2020: Q4 Sales & New Listings
/in Asking Prices, Average Sales Price, Inventory Levels, Jackson Hole Real Estate, Jackson Hole Report, Land/Building Sites, Listing Prices, Luxury Property, Market Report, Market Reports, Market Statistics, Monthly Market Update, Multi-family, Over $1 million, Past Sales, Properties under $500, Real Estate Sales, Sale to List Price Ratio, Sales Volume, Sellers, Single family homes, The Jackson Hole Report, Town of Jackson, Townhome, Under $500, WY/by Molly StewartTransactions/Sales Volume – What Sold?
$2,950,273
Average Sales Price
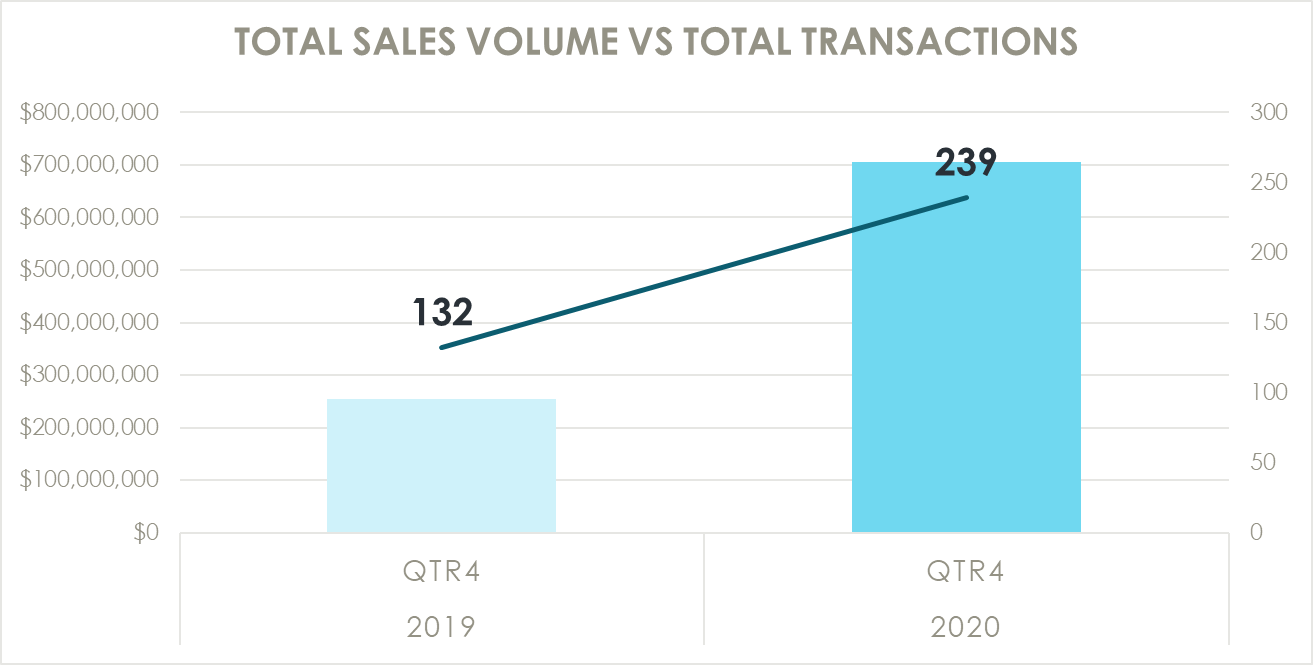
$705,115,180
Total Sales Volume
Market Analysis
After a record setting Q3 2020 (with 100 more transactions and more than double the sales volume), it was hard to imagine the trend would continue past the busy summer selling season. Well, 4th quarter sales suggest things are not slowing down – recording 107 more transactions than Q4 in 2019. Even more impressive was the sold dollar volume this past quarter – up a staggering $450 million from the fourth quarter in 2019. Put another way, while the number of real estate sales increased 81% over Q4 2019, the sales volume increased 177% from this time last year. These unprecedented statistics illustrate an ongoing explosion of demand in Jackson Hole real estate as out of town buyers continue to flock to places like Jackson Hole amid the pandemic. This seemingly bottomless demand for the JH lifestyle helped push the average sales price up more than $1 million over the 4th quarter of 2019. Sale prices increased across the market, with the median sales price up every month, including a $1.2 million bump in November alone. Nearly every price point saw significant increases in sales, with the most notable shift occurring in the high end luxury market, where 60 more properties sold above $3 million in Q4 2020. The only segment not seeing a significant increase in sales was the entry level, where 2 fewer properties sold under $500,000 in Q4 2020. Vacant land sales experienced an unexpected surge in sales, representing 28% of all sales in Q4 2020 vs. 14% of sales in Q4 2019. As existing single family homes were snatched up this past summer, many buyers were forced to purchase building sites as an alternative way to get into the Jackson Hole market. Single family homes sales represented only 33% of sales in Q4 2020 (vs. 47% of sales in Q4 2019).
New Listings – What’s New?
$3,771,141
AvERAGE LIST PRICE
$427,442,500
LIST PRICE Volume
Market Analysis
New inventory was up in the fourth quarter, with 24 more listings hitting the market than in Q4 2019. More sellers put their properties on the market in October and November this year, no doubt encouraged by the booming real estate market. The dollar volume of those new listings also increased, up nearly $150 million over Q4 2019, thanks to a strong November that saw $172 million in new inventory hit the market. Overall, the average listing price was up in Q4 2020, with the majority of that increase coming from the month of November, where the average listing price was just under $4 million, up from $1.7 million in November 2019. The median list price followed a similar trend, with November’s median listing price $1.5 million higher than Nov 2019. The breakdown of listing price points was nearly identical between Q4 2020 and Q4 2019 with one exception – the luxury market ($3 million+) saw listings increase two fold, with nearly 50 properties entering the market in the last 3 months of 2020. Interestingly, this past December’s listings and listing volume didn’t see the same increases as the previous months in 2020. Listings, dollar volume and average/median listing prices were instead all on par with December 2019. Are things slowing down? Has everyone that wanted to sell already sold their properties? What is in store for inventory levels in 2021?


