Tag Archive for: real estate inventory jackson wy

2021: Q1 Sales & New Listings

Transactions/Sales Volume – What Sold?

$2,970,116

Average Sales Price

[siteorigin_widget class=”Inked_Number_Counter_SO_Widget”][/siteorigin_widget]

$389M

Total Sales Volume

[siteorigin_widget class=”SiteOrigin_Widget_Image_Widget”][/siteorigin_widget]
[siteorigin_widget class=”SiteOrigin_Widget_Image_Widget”][/siteorigin_widget]
[siteorigin_widget class=”SiteOrigin_Widget_Image_Widget”][/siteorigin_widget]

Market Analysis

Reviewing first quarter stats is very helpful in evaluating the pre-pandemic real estate market to the post-pandemic real estate boom seen here in Jackson Hole as well as many other places in the country. We all know the market increased, but by how much? There were 40 more real estate sales in Q1 2021 than the same time in 2020, an increase of 44%. Despite seeing fewer sales in January 2021, sales in February and March were roughly double the pre-pandemic levels seen in early 2020. Sales volume has skyrocketed, with $175 million MORE in volume in Q1 2021, a staggering increase of 82% over the start of 2020. Similar to transactions, sales volume was inline with January 2020, but in February and March sales volume was double that of 2020, for a grand total of $389 million in the first quarter of 2021. It’s interesting to note that the 4-year average for sales volume in the first quarter is only $172 million – we’ve seen quite the increase over the last 5 years!

The average sale price was up each month and up $600,000 over the quarter, representing a 26% increase from early 2020. The median sale price was also up every month, ranging from $1.65 million to $2.14 million. Sales increased in nearly every price point with the largest increase in the $3 million and up segment, where there were 18 more sales in the first quarter of 2021. Sales in the $1-3 million range also saw a significant increase with 17 more sales this year. The biggest shift in property type was for vacant lots where nearly 2 times as many building sites sold in the first quarter of 2021, representing 24% of all sales (up from 16% in Q1 2020).

[siteorigin_widget class=”SiteOrigin_Widget_Cta_Widget”][/siteorigin_widget]
[siteorigin_widget class=”SiteOrigin_Widget_Image_Widget”][/siteorigin_widget]
[siteorigin_widget class=”SiteOrigin_Widget_Image_Widget”][/siteorigin_widget]
[siteorigin_widget class=”SiteOrigin_Widget_Image_Widget”][/siteorigin_widget]
[siteorigin_widget class=”SiteOrigin_Widget_Image_Widget”][/siteorigin_widget]
[siteorigin_widget class=”SiteOrigin_Widget_Image_Widget”][/siteorigin_widget]
[siteorigin_widget class=”SiteOrigin_Widget_Image_Widget”][/siteorigin_widget]

New Listings – What’s New?

$3,483,409

AvERAGE LIST PRICE

[siteorigin_widget class=”Inked_Number_Counter_SO_Widget”][/siteorigin_widget]

$433,241,500

LIST PRICE Volume

[siteorigin_widget class=”SiteOrigin_Widget_Image_Widget”][/siteorigin_widget]
[siteorigin_widget class=”SiteOrigin_Widget_Image_Widget”][/siteorigin_widget]
[siteorigin_widget class=”SiteOrigin_Widget_Image_Widget”][/siteorigin_widget]

Market Analysis

New listings in the first quarter of 2021 are actually up when compared to the start last year. The number of new listings this year outpaced 2020 in both January and March for a total of 10 more listings in the first quarter, an increase of 8.7%. This doesn’t necessarily mean there are more things to buy as nearly all of the available inventory was cleared out in Q3 & Q4 2020 during the pandemic inflicted real estate boom here in Jackson Hole. With only 10 more listings, the total listing volume was up $127 million, a staggering increase of 41.5%. After outpacing listing volume in January, and seeing similar levels in February, listing volume was $100 million higher in March 2021, with only 5 more listings. As to be expected, the average listing price jumped from $2.733 million before the pandemic, to $3.483 million in the start of 2021, an increase of $750,000 or 27%. This significant increase was no doubt helped by the month of March 2021 where the average listing price nearly reached $4 million. The average median listing price also increased significantly, going from $1.67 million to just over $2.2 million, an increase of over $500,000, equating to a 32% jump.

More building sites entered the market in Q1 2021, representing 23% of all new listings (vs. 17% in Q1 2020). Nearly all of the available lot inventory was sold out in Q3 and Q4 2020, no doubt encouraging other lot owners to take advantage of low supply levels and put their (snow covered) property on the market in early 2021. Currently there are only 19 lots for sale in all of Teton County! The first quarter saw a spike in new listings over $3 million with 20 more properties hitting the market in this price point. On the other end of the spectrum, there were 11 fewer listings under the  $1 million mark. Currently there are only 8 properties in all of Teton County available under $1,000,000.

[siteorigin_widget class=”SiteOrigin_Widget_Cta_Widget”][/siteorigin_widget]
[siteorigin_widget class=”SiteOrigin_Widget_Image_Widget”][/siteorigin_widget]
[siteorigin_widget class=”SiteOrigin_Widget_Image_Widget”][/siteorigin_widget]
[siteorigin_widget class=”SiteOrigin_Widget_Image_Widget”][/siteorigin_widget]
[siteorigin_widget class=”SiteOrigin_Widget_Image_Widget”][/siteorigin_widget]
[siteorigin_widget class=”SiteOrigin_Widget_Image_Widget”][/siteorigin_widget]
[siteorigin_widget class=”SiteOrigin_Widget_Image_Widget”][/siteorigin_widget]
Note: All statistics are pulled from Teton Board of Realtors Multiple Listing Service for residential sales/listings in Teton County, WY for the dates specified above. It is estimated that sales outside of MLS account for an additional 10-20% of transactions/volume. Contact Katie for more details.

2020: Q4 Sales & New Listings

Transactions/Sales Volume – What Sold?

$2,950,273

Average Sales Price

[siteorigin_widget class=”Inked_Number_Counter_SO_Widget”][/siteorigin_widget]

$705,115,180

Total Sales Volume

[siteorigin_widget class=”SiteOrigin_Widget_Image_Widget”][/siteorigin_widget]
[siteorigin_widget class=”SiteOrigin_Widget_Image_Widget”][/siteorigin_widget]
[siteorigin_widget class=”SiteOrigin_Widget_Image_Widget”][/siteorigin_widget]

Market Analysis

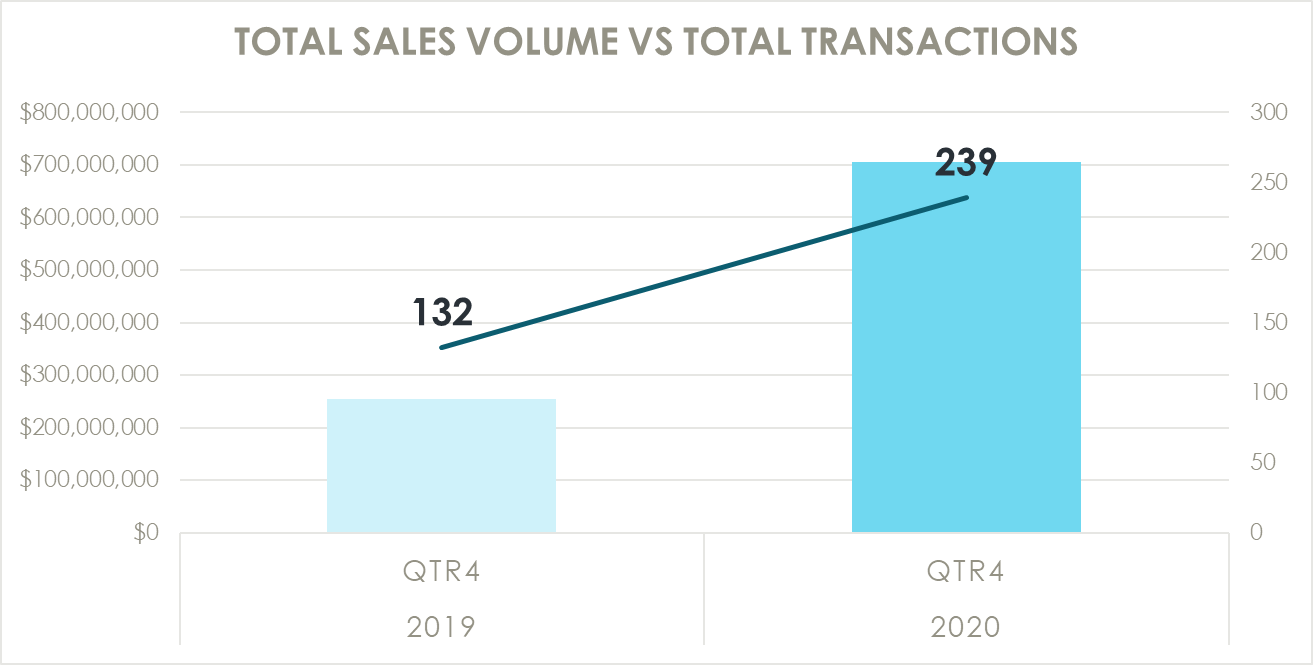
After a record setting Q3 2020 (with 100 more transactions and more than double the sales volume), it was hard to imagine the trend would continue past the busy summer selling season. Well, 4th quarter sales suggest things are not slowing down – recording 107 more transactions than Q4 in 2019. Even more impressive was the sold dollar volume this past quarter – up a staggering $450 million from the fourth quarter in 2019. Put another way, while the number of real estate sales increased 81% over Q4 2019, the sales volume increased 177% from this time last year. These unprecedented statistics illustrate an ongoing explosion of demand in Jackson Hole real estate as out of town buyers continue to flock to places like Jackson Hole amid the pandemic. This seemingly bottomless demand for the JH lifestyle helped push the average sales price up more than $1 million over the 4th quarter of 2019. Sale prices increased across the market, with the median sales price up every month, including a $1.2 million bump in November alone. Nearly every price point saw significant increases in sales, with the most notable shift occurring in the high end luxury market, where 60 more properties sold above $3 million in Q4 2020. The only segment not seeing a significant increase in sales was the entry level, where 2 fewer properties sold under $500,000 in Q4 2020. Vacant land sales experienced an unexpected surge in sales, representing 28% of all sales in Q4 2020 vs. 14% of sales in Q4 2019. As existing single family homes were snatched up this past summer, many buyers were forced to purchase building sites as an alternative way to get into the Jackson Hole market. Single family homes sales represented only 33% of sales in Q4 2020 (vs. 47% of sales in Q4 2019).

[siteorigin_widget class=”SiteOrigin_Widget_Cta_Widget”][/siteorigin_widget]
[siteorigin_widget class=”SiteOrigin_Widget_Image_Widget”][/siteorigin_widget]
[siteorigin_widget class=”SiteOrigin_Widget_Image_Widget”][/siteorigin_widget]
[siteorigin_widget class=”SiteOrigin_Widget_Image_Widget”][/siteorigin_widget]
[siteorigin_widget class=”SiteOrigin_Widget_Image_Widget”][/siteorigin_widget]
[siteorigin_widget class=”SiteOrigin_Widget_Image_Widget”][/siteorigin_widget]
[siteorigin_widget class=”SiteOrigin_Widget_Image_Widget”][/siteorigin_widget]

New Listings – What’s New?

$3,771,141

AvERAGE LIST PRICE

[siteorigin_widget class=”Inked_Number_Counter_SO_Widget”][/siteorigin_widget]

$427,442,500

LIST PRICE Volume

[siteorigin_widget class=”SiteOrigin_Widget_Image_Widget”][/siteorigin_widget]
[siteorigin_widget class=”SiteOrigin_Widget_Image_Widget”][/siteorigin_widget]
[siteorigin_widget class=”SiteOrigin_Widget_Image_Widget”][/siteorigin_widget]

Market Analysis

New inventory was up in the fourth quarter, with 24 more listings hitting the market than in Q4 2019. More sellers put their properties on the market in October and November this year, no doubt encouraged by the booming real estate market. The dollar volume of those new listings also increased, up nearly $150 million over Q4 2019, thanks to a strong November that saw $172 million in new inventory hit the market. Overall, the average listing price was up in Q4 2020, with the majority of that increase coming from the month of November, where the average listing price was just under $4 million, up from $1.7 million in November 2019. The median list price followed a similar trend, with November’s median listing price $1.5 million higher than Nov 2019. The breakdown of listing price points was nearly identical between Q4 2020 and Q4 2019 with one exception – the luxury market ($3 million+) saw listings increase two fold, with nearly 50 properties entering the market in the last 3 months of 2020. Interestingly, this past December’s listings and listing volume didn’t see the same increases as the previous months in 2020. Listings, dollar volume and average/median listing prices were instead all on par with December 2019. Are things slowing down? Has everyone that wanted to sell already sold their properties? What is in store for inventory levels in 2021?

[siteorigin_widget class=”SiteOrigin_Widget_Cta_Widget”][/siteorigin_widget]
[siteorigin_widget class=”SiteOrigin_Widget_Image_Widget”][/siteorigin_widget]
[siteorigin_widget class=”SiteOrigin_Widget_Image_Widget”][/siteorigin_widget]
[siteorigin_widget class=”SiteOrigin_Widget_Image_Widget”][/siteorigin_widget]
[siteorigin_widget class=”SiteOrigin_Widget_Image_Widget”][/siteorigin_widget]
[siteorigin_widget class=”SiteOrigin_Widget_Image_Widget”][/siteorigin_widget]
[siteorigin_widget class=”SiteOrigin_Widget_Image_Widget”][/siteorigin_widget]
Note: All statistics are pulled from Teton Board of Realtors Multiple Listing Service for residential sales/listings in Teton County, WY for the dates specified above. It is estimated that sales outside of MLS account for an additional 10-20% of transactions/volume. Contact Katie for more details.

2020: Q3 Sales & New Listings

Transactions/Sales Volume – What Sold?

$2,940,989

Average Sales Price

[siteorigin_widget class=”Inked_Number_Counter_SO_Widget”][/siteorigin_widget]

$735,247,347

Total Sales Volume

[siteorigin_widget class=”SiteOrigin_Widget_Image_Widget”][/siteorigin_widget]
[siteorigin_widget class=”SiteOrigin_Widget_Image_Widget”][/siteorigin_widget]
[siteorigin_widget class=”SiteOrigin_Widget_Image_Widget”][/siteorigin_widget]

Market Analysis

If you’ve been following the Jackson Hole real estate market at all this summer then it will come in no surprise to hear that we’ve had one of the most explosive third quarters in market history. All market statistics were up in Q3 2020, many significantly so. The 3rd quarter of 2020 (July-Aug-Sept) recorded nearly 100 more sales than Q3 last year, which was considered a strong quarter/year. Monthly sales exceeded 2019 in every month, nearly doubling last year’s numbers in August and September specifically. Even more dramatic, overall sales dollar volume in Q3 2020 dwarfed numbers seen last year, up a staggering $448 million. Monthly sales volume in Q3 2020 was over double that of 2019.
As expected, the average sales price of the third quarter this year increased significantly, up more than $1 million over Q3 2019. The median sales price also increased, up an average of $500,000 over the 3 months of the third quarter, and far outpacing median sales prices in each month. Similar to 2019, the majority of sales in Q3 2020 occurred in the $1-3 million price point, however in 2020 there were 36 more sales in this price point. The largest shift from last year was in the luxury high-end segment ($3+ million) where 48 more sales recorded this year vs Q3 2020, no doubt a contributor to the historic sales volume seen this summer in Jackson Hole. Over half of the sales in the third quarter were for single family homes, an increase from 2019. Interestingly, 2020 saw fewer condo / townhome sales and more land sales as many out-of-town buyers looked to purchase land as existing inventory continued to dwindle.
[siteorigin_widget class=”SiteOrigin_Widget_Cta_Widget”][/siteorigin_widget]
[siteorigin_widget class=”SiteOrigin_Widget_Image_Widget”][/siteorigin_widget]
[siteorigin_widget class=”SiteOrigin_Widget_Image_Widget”][/siteorigin_widget]
[siteorigin_widget class=”SiteOrigin_Widget_Image_Widget”][/siteorigin_widget]
[siteorigin_widget class=”SiteOrigin_Widget_Image_Widget”][/siteorigin_widget]
[siteorigin_widget class=”SiteOrigin_Widget_Image_Widget”][/siteorigin_widget]
[siteorigin_widget class=”SiteOrigin_Widget_Image_Widget”][/siteorigin_widget]

New Listings – What’s New?

$3,410,444

AvERAGE LIST PRICE

[siteorigin_widget class=”Inked_Number_Counter_SO_Widget”][/siteorigin_widget]

$836,169,000

LIST PRICE Volume

[siteorigin_widget class=”SiteOrigin_Widget_Image_Widget”][/siteorigin_widget]
[siteorigin_widget class=”SiteOrigin_Widget_Image_Widget”][/siteorigin_widget]
[siteorigin_widget class=”SiteOrigin_Widget_Image_Widget”][/siteorigin_widget]

Market Analysis

It’s no doubt that demand for Jackson Hole real estate was up significantly this past summer, but how did things look on the supply/listing side? Overall new listings in Q3 2020 were up only slightly from 2019, mirroring monthly levels seen last year. While reporting a similar number of new listings as last year, the overall dollar volume of these listings increased dramatically, recording $200+ million more in volume in Q3 2020. Much of this increase can be attributed to a very strong September where a similar number of new listings hit the market but accounted for nearly $185 million more in listing volume than in Q3 2019. As a result, the average listing price for the third quarter increased nearly $1 million from this time last year. The average median list price for the quarter was also up, topping $2 million from $1.45 million in Q3 2019. Again, both helped by a very strong September which saw a monthly average list price over $4 million and a median list price of more than $3 million.
In an interesting flip from Q3 2019, the majority of new listings this summer were in the high-end luxury market with nearly 100 listings coming online priced above $3 million (compared to 46 new listings in Q3 2019). We saw significantly fewer new listings in the $1-3 million range while maintaining similar levels for price points under $1 million. As a response to the increased sales of building sites in Q3 2020, we saw an influx of vacant land listings, as many landowners saw this summer as a great opportunity to capture the new demand of out of town buyers frustrated by a lack of existing inventory.
[siteorigin_widget class=”SiteOrigin_Widget_Cta_Widget”][/siteorigin_widget]
[siteorigin_widget class=”SiteOrigin_Widget_Image_Widget”][/siteorigin_widget]
[siteorigin_widget class=”SiteOrigin_Widget_Image_Widget”][/siteorigin_widget]
[siteorigin_widget class=”SiteOrigin_Widget_Image_Widget”][/siteorigin_widget]
[siteorigin_widget class=”SiteOrigin_Widget_Image_Widget”][/siteorigin_widget]
[siteorigin_widget class=”SiteOrigin_Widget_Image_Widget”][/siteorigin_widget]
[siteorigin_widget class=”SiteOrigin_Widget_Image_Widget”][/siteorigin_widget]
Note: All statistics are pulled from Teton Board of Realtors Multiple Listing Service for residential sales/listings in Teton County, WY for the dates specified above. It is estimated that sales outside of MLS account for an additional 10-20% of transactions/volume. Contact Katie for more details.

2020: Q2 Sales & New Listings

Transactions/Sales Volume – What Sold?

$2,303,461

Average Sales Price

[siteorigin_widget class=”Inked_Number_Counter_SO_Widget”][/siteorigin_widget]

$145,118,024

Total Sales Volume

[siteorigin_widget class=”SiteOrigin_Widget_Image_Widget”][/siteorigin_widget]
[siteorigin_widget class=”SiteOrigin_Widget_Image_Widget”][/siteorigin_widget]
[siteorigin_widget class=”SiteOrigin_Widget_Image_Widget”][/siteorigin_widget]

Market Analysis

The Jackson Hole real estate market saw 63 sales in the second quarter of 2020, a far cry from the 110 sales in the second quarter of 2019. While 2019 was a strong year all around, this decline of 43% is significant. Every month of the second quarter showed notably fewer sales with the largest gap happening in May, when 2020 sales were less than half of sales in May 2019. This decline suggests that the pandemic played a role (at least initially) in buyer’s collective willingness to make real estate purchases in Jackson Hole. That being said, it appears the gap may be closing, with only 10 fewer sales in June vs 2019, perhaps an early indication of increasing interest/sales as we move through the summer with the influx of out of town visitors and buyers. Despite 42% fewer sales, dollar volume was nearly identical ($145 million in Q2 2020 vs $148 million in Q2 2019). As a result, the average sale price jumped nearly $1 million from the second quarter last year to Q2 this year, outpacing 2019 in every month (twice as high in the month of May!). The median sales price followed a similar trend, exceeding 2019 median sales prices by roughly 40% in every month of the second quarter.
In looking at the breakdown by price point, the $500,000 to $1 million segment saw 20 fewer sales in Q2 2020, while only 4 sales occurred under $500,000 (vs. 28 sales in Q2 2019). On the other end of the spectrum, the luxury end remained strong with an identical number of sales over $3 million (despite overall sales being down). More than 3 out of every 4 sales in the second quarter of 2020 was for a single family home vs. 35% in Q2 2019, no doubt a contributing factor to the higher prices/values.
[siteorigin_widget class=”SiteOrigin_Widget_Cta_Widget”][/siteorigin_widget]
[siteorigin_widget class=”SiteOrigin_Widget_Image_Widget”][/siteorigin_widget]
[siteorigin_widget class=”SiteOrigin_Widget_Image_Widget”][/siteorigin_widget]
[siteorigin_widget class=”SiteOrigin_Widget_Image_Widget”][/siteorigin_widget]
[siteorigin_widget class=”SiteOrigin_Widget_Image_Widget”][/siteorigin_widget]
[siteorigin_widget class=”SiteOrigin_Widget_Image_Widget”][/siteorigin_widget]
[siteorigin_widget class=”SiteOrigin_Widget_Image_Widget”][/siteorigin_widget]

New Listings – What’s New?

$2,996,894

AvERAGE LIST PRICE

[siteorigin_widget class=”Inked_Number_Counter_SO_Widget”][/siteorigin_widget]

$605,785,000

LIST PRICE Volume

[siteorigin_widget class=”SiteOrigin_Widget_Image_Widget”][/siteorigin_widget]
[siteorigin_widget class=”SiteOrigin_Widget_Image_Widget”][/siteorigin_widget]
[siteorigin_widget class=”SiteOrigin_Widget_Image_Widget”][/siteorigin_widget]

Market Analysis

The number of new listings was down roughly 17% in the second quarter of 2020 with just over 200 properties hitting the market in April/May/June. Compare that to the second quarter of last year when 246 new properties entered the market. New listings in 2020 lagged 2019 in April and May, no doubt a result of sellers’ hesitation in the first few months of the COVID pandemic. Only in June of 2020 did new listings exceed 2019 with 6 more properties entering the market.
The dollar volume of new listings in Q2 2020 also declined, down 17% from Q2 2019. After seeing a similar listing dollar volume in April, both May and June under performed levels seen in 2019. The monthly average listing price fluctuated in 2020, from $3.3 million in April dropping to $2.3 million in May and jumping back up in June. The median list price followed a similar trend, but exceeded 2019 median list prices in every month of the second quarter, illustrating an overall increase in listing prices. The majority (46%) of new listings in Q2 2020 were in the $1-3 million range. Despite fewer listings, the luxury segment saw a similar number of new listings priced over $3 million (53 vs 56), while the entry level (under $500,000) dropped 50% from 16 to 8 new listings.
[siteorigin_widget class=”SiteOrigin_Widget_Cta_Widget”][/siteorigin_widget]
[siteorigin_widget class=”SiteOrigin_Widget_Image_Widget”][/siteorigin_widget]
[siteorigin_widget class=”SiteOrigin_Widget_Image_Widget”][/siteorigin_widget]
[siteorigin_widget class=”SiteOrigin_Widget_Image_Widget”][/siteorigin_widget]
[siteorigin_widget class=”SiteOrigin_Widget_Image_Widget”][/siteorigin_widget]
[siteorigin_widget class=”SiteOrigin_Widget_Image_Widget”][/siteorigin_widget]
[siteorigin_widget class=”SiteOrigin_Widget_Image_Widget”][/siteorigin_widget]
Note: All statistics are pulled from Teton Board of Realtors Multiple Listing Service for residential sales/listings in Teton County, WY for the dates specified above. It is estimated that sales outside of MLS account for an additional 10-20% of transactions/volume. Contact Katie for more details.

2020: Q1 Sales & New Listings

Transactions/Sales Volume – What Sold?

$2,357,062

Average Sales Price

[siteorigin_widget class=”Inked_Number_Counter_SO_Widget”][/siteorigin_widget]

$214,492,681

Total Sales Volume

[siteorigin_widget class=”SiteOrigin_Widget_Image_Widget”][/siteorigin_widget]
[siteorigin_widget class=”SiteOrigin_Widget_Image_Widget”][/siteorigin_widget]
[siteorigin_widget class=”SiteOrigin_Widget_Image_Widget”][/siteorigin_widget]

Market Analysis

Real estate sales in Jackson Hole in the first quarter of 2020 were slightly lower than sales in the first quarter last year. After just barely outpacing 2019 in January and February, a slower than usual March (with 7 fewer sales) contributed to an overall drop in sales from Q1 2019 to this year. Despite having 4 fewer sales, overall dollar volume was up about $15 million in Q1 2020, with higher monthly sales volume in all 3 months of the first quarter this year (even in March which had the 7 fewer sales). After seeing consistent average prices in January and February, the average sale price in March 2020 was up 44% versus March 2019, thanks to several high-end sales last month. As a result, the overall average sale price of Q1 2020 was up 12.5% versus Q1 2019. In looking at the median sale price, we see a somewhat similar trend. After falling short in both January and February, the median sales price in March was significantly higher, recording the highest median sale price in over a year and pulling the overall average of Q1 median sale prices in line with Q1 2019 ($1.415 million vs $1.453 million).

Which price point saw the most sales in the first quarter? Property sales in the $1-3 million range represented the majority of sales in each of the first 3 months in 2020, accounting for 40 of the 91 sales in the first quarter (44%). This is slightly higher than 2019, where 40% of sales occurred in this price point. The first quarter of 2020 saw 3 more high-end sales (above $3 million) but 11 fewer sales in the under $500,000 segment, a decline of 61%. While single family homes made up a similar percentage of sales in Q1 2020 versus Q1 2019, the first quarter of 2020 saw 9 more lot sales and 9 fewer condo/townhome sales than the first quarter of 2019.

[siteorigin_widget class=”SiteOrigin_Widget_Cta_Widget”][/siteorigin_widget]
[siteorigin_widget class=”SiteOrigin_Widget_Image_Widget”][/siteorigin_widget]
[siteorigin_widget class=”SiteOrigin_Widget_Image_Widget”][/siteorigin_widget]
[siteorigin_widget class=”SiteOrigin_Widget_Image_Widget”][/siteorigin_widget]
[siteorigin_widget class=”SiteOrigin_Widget_Image_Widget”][/siteorigin_widget]
[siteorigin_widget class=”SiteOrigin_Widget_Image_Widget”][/siteorigin_widget]
[siteorigin_widget class=”SiteOrigin_Widget_Image_Widget”][/siteorigin_widget]

New Listings – What’s New?

$2,733,819

AvERAGE LIST PRICE

[siteorigin_widget class=”Inked_Number_Counter_SO_Widget”][/siteorigin_widget]

$306,201,000

LIST PRICE Volume

[siteorigin_widget class=”SiteOrigin_Widget_Image_Widget”][/siteorigin_widget]
[siteorigin_widget class=”SiteOrigin_Widget_Image_Widget”][/siteorigin_widget]
[siteorigin_widget class=”SiteOrigin_Widget_Image_Widget”][/siteorigin_widget]

Market Analysis

The number of new listings entering the market in the first quarter of 2020 was nearly identical to the first quarter of 2019, however the timing of these new listing entering the market was very different. January 2020’s 32 new listings paled in comparison to the 55 new listings in January 2019. This difference may be explained by the fact that after a dynamite 2018, many sellers were encouraged to put their properties on the market in early 2019. February 2020 saw an unusually high number of new listings with 20 more properties hitting the market compared to February 2019. Finishing out the first quarter, new listings in March 2020 were consistent with March 2019. Despite having a similar number of new listings as Q1 2019, the dollar volume of the new listings in Q1 2020 was significantly higher, recording $93 million more in listing volume, an increase of 44%! Even though January 2020 saw 23 fewer sales than Jan 2019, dollar volume was strong ($110 million). February 2020’s new listing volume surpassed January, recording $88 million more in listing volume than February 2019. Finally, March 2020 outpaced March 2019 by $14 million. The average listing price has been declining since a high in December of $3.9 million, dipping below $2 million for the first time since November 2019. Despite the declining trend, the average listing price for the entire quarter was still nearly $1 million higher than the average listing price in Q1 2019. The median list price followed a similar trend. After a high of $2.3 million in January, we’ve seen a significant drop in each of the last two months, down to just above $1 million in March, the lowest median list price in over a year. However, the average median list price of Q1 2020 was still approx. $600,000 higher than this time last year.

The majority (40%) of new listings entered the market between $1-3 million in the first quarter of 2020. February was the most popular month for this price point with 20 new listings hitting the market. Interestingly, March saw a surge of listings in the $500,000 – $1 million segment, when 19 new options entered the market. Comparing quarter to quarter, 2020 saw more new listings in all price points (including the high-end where 10 more listings hit the market) with the exception of the entry level. There were only 5 new listings under $500,000 in the first 3 months of 2020 vs. 24 new listings in Q1 2019. Note: 18 of the 24 new listings represented the newly remodeled Virginian Village Condos, new to the market during Q1 last year.

[siteorigin_widget class=”SiteOrigin_Widget_Cta_Widget”][/siteorigin_widget]
[siteorigin_widget class=”SiteOrigin_Widget_Image_Widget”][/siteorigin_widget]
[siteorigin_widget class=”SiteOrigin_Widget_Image_Widget”][/siteorigin_widget]
[siteorigin_widget class=”SiteOrigin_Widget_Image_Widget”][/siteorigin_widget]
[siteorigin_widget class=”SiteOrigin_Widget_Image_Widget”][/siteorigin_widget]
[siteorigin_widget class=”SiteOrigin_Widget_Image_Widget”][/siteorigin_widget]
[siteorigin_widget class=”SiteOrigin_Widget_Image_Widget”][/siteorigin_widget]
Note: All statistics are pulled from Teton Board of Realtors Multiple Listing Service for residential sales/listings in Teton County, WY for the dates specified above. It is estimated that sales outside of MLS account for an additional 10-20% of transactions/volume. Contact Katie for more details.

2020: January New Listings in Jackson Hole

What happened in January?

New Listings

The first month of the New Year saw 32 new listings enter the market, a slight increase over December 2019, however still roughly one-third of new inventory seen during the summer months. Listing volume topped $110 million for the second month in a row. The average listing price dropped slightly from December but remained strong at $3.4 million, continuing to outpace the average sale price by more than a $1 million for the last 2 months. The median list price spiked in January, topping $2 million for the first time since I began tracking this stat in April 2017. Not a surprise, considering that over 80% of January new listings were over $1 million with a whopping 40% of new listings over $3 million last month. Several high end homes came on the market at 3 Creek ($11.75 million), Solitude ($7.5 million) and a beautiful custom home north of town, listed for $16.9 million (and already under contract!). Only 5 new listings entered the “locals market” ($500,000 – $1 million) and only one property hit the market under $500,000 – a one bedroom condo in East Jackson, listed for $365,000 that received 3 immediate offers. New listings were split almost equally between single family homes (14) and townhomes (13) with 5 vacant lots coming onto the market in January, including a unique parcel on Huffsmith Hill with stunning Teton views, listed for $5.1 million.

[siteorigin_widget class=”Inked_Number_Counter_SO_Widget”][/siteorigin_widget]
[siteorigin_widget class=”SiteOrigin_Widget_Image_Widget”][/siteorigin_widget]

$110,237,000

New Listing Volume

[siteorigin_widget class=”SiteOrigin_Widget_Image_Widget”][/siteorigin_widget]

5

Vacant Lot Listings

[siteorigin_widget class=”SiteOrigin_Widget_Image_Widget”][/siteorigin_widget]

$3,444,906

Average List Price

[siteorigin_widget class=”SiteOrigin_Widget_Image_Widget”][/siteorigin_widget]

$2,347,000

MEDIAN LIST PRICE

[siteorigin_widget class=”SiteOrigin_Widget_Image_Widget”][/siteorigin_widget]

1

listings under $500,000

[siteorigin_widget class=”SiteOrigin_Widget_Image_Widget”][/siteorigin_widget]

13

Listings over $3M

[siteorigin_widget class=”SiteOrigin_Widget_Image_Widget”][/siteorigin_widget]
[siteorigin_widget class=”SiteOrigin_Widget_Cta_Widget”][/siteorigin_widget]
Note: All statistics are pulled from Teton Board of Realtors Multiple Listing Service for residential sales/listings in Teton County, WY for the dates specified above. It is estimated that sales outside of MLS account for an additional 10-20% of transactions/volume. Contact Katie for more details.

2019: Q4 Sales & New Listings

Transactions/Sales Volume – What Sold?

$1,930,301

Average Sales Price

[siteorigin_widget class=”Inked_Number_Counter_SO_Widget”][/siteorigin_widget]

$254,799,682

Total Sales Volume

[siteorigin_widget class=”SiteOrigin_Widget_Image_Widget”][/siteorigin_widget]
[siteorigin_widget class=”SiteOrigin_Widget_Image_Widget”][/siteorigin_widget]
[siteorigin_widget class=”SiteOrigin_Widget_Image_Widget”][/siteorigin_widget]

Market Analysis

The 4th quarter of 2019 looked a lot like the 4th quarter of 2018. Total sales increased ever so slightly, up from 130 in 2018 to 132 sales in 2019. In looking at numbers month-by-month, while 2019 saw a few more sales in October and December, it was balanced out by a few less sales in November. Dollar volume was also similar quarter to quarter, and actually dropped 1.7% from Q4 2018, recording a total of $254,800,000 in Q4 2019. Monthly dollar volume in 2019 outpaced 2018 most significantly in October, recording over $108 million in volume vs $91 million in October 2018. November was a bit slower in 2019 while December was identical at $66 million for the month. As expected, the average sale price was also consistent between 2018 and 2019 slipping down to $1.93 million from $1.99 million in 2018. In analyzing price points, sales in the $1-3 million range were up 15% while sales in the $500,000-$1,000,000 range dropped by 17% compared to Q4 2018. This upward shift in price point is reflected in the median sales price, which was higher in each month of Q4 2019. Sales under $500,000 stayed consistent, recording 12 sales in all of the 4th quarter. Townhomes and condos represented slightly more of the sales in 2019, while lot sales remained steady, representing 16% of all sales in Q4 2019.  What does all this mean? While things aren’t necessarily slowing down, the rate of acceleration has appeared to slow. Will we see more of the same in 2020 or is this an indication of the market leveling off as we enter the next decade? Stay tuned!

[siteorigin_widget class=”SiteOrigin_Widget_Cta_Widget”][/siteorigin_widget]
[siteorigin_widget class=”SiteOrigin_Widget_Image_Widget”][/siteorigin_widget]
[siteorigin_widget class=”SiteOrigin_Widget_Image_Widget”][/siteorigin_widget]
[siteorigin_widget class=”SiteOrigin_Widget_Image_Widget”][/siteorigin_widget]
[siteorigin_widget class=”SiteOrigin_Widget_Image_Widget”][/siteorigin_widget]
[siteorigin_widget class=”SiteOrigin_Widget_Image_Widget”][/siteorigin_widget]
[siteorigin_widget class=”SiteOrigin_Widget_Image_Widget”][/siteorigin_widget]

New Listings – What’s New?

$3,023,767

AvERAGE LIST PRICE

[siteorigin_widget class=”Inked_Number_Counter_SO_Widget”][/siteorigin_widget]

$278,891,000

LIST PRICE Volume

[siteorigin_widget class=”SiteOrigin_Widget_Image_Widget”][/siteorigin_widget]
[siteorigin_widget class=”SiteOrigin_Widget_Image_Widget”][/siteorigin_widget]
[siteorigin_widget class=”SiteOrigin_Widget_Image_Widget”][/siteorigin_widget]

Market Analysis

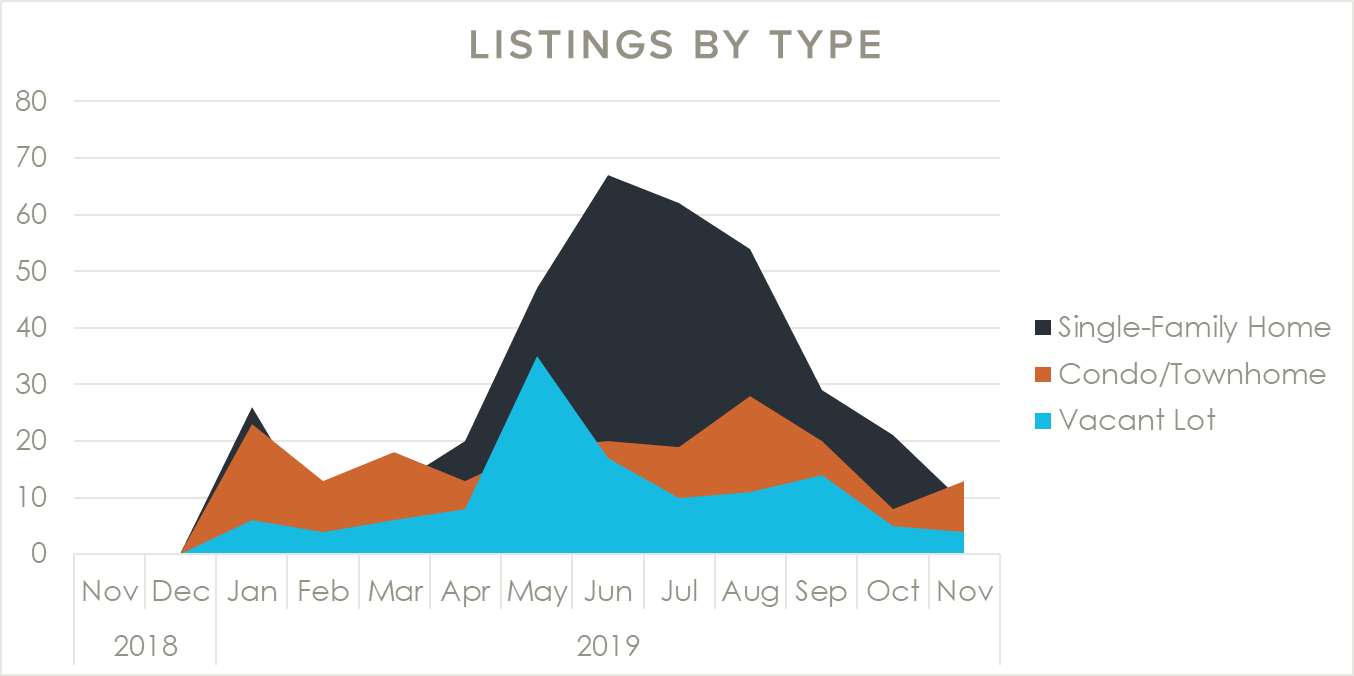
New inventory was down, but listing prices were up in the 4th quarter of 2019, where 18 fewer properties hit the market – a drop of 17% from the same time in 2018. New listings were down every month in the 4th quarter with the biggest drop coming in October, when only 34 properties hit the market (vs. 46 in October 2018). Despite having 17% fewer options in 2019, buyers saw those options increase in price with total dollar volume jumping 12% from Q4 2018. October & December were big dollar months, recording $116 million and $117 million in new listings respectively. As a result, the average listing price jumped up dramatically in the 4th quarter, going from $2.3 million in Q4 2018 to above $3 million in Q4 2019. The median list price saw a more modest, yet still significant, increase from $1.26 million to $1.37 million – a jump of 9%. The spike in dollar volume and average listing price is supported by the price point of several high end listings in Q4 2019. While a similar number of these $3+ million listings hit the market in Q4 2019 and Q4 2018, this past year saw several ultra-high-end listings including: a contemporary home with stunning views atop Spring Creek Ranch for $15 million, a 3 lot estate on 20+ acres south of Wilson for $25 million, and a recently listed 18,000 sq foot home, guest home and barn on 215 acres in the heart of Jackson Hole for $35 million. For much of 2019, we saw higher priced inventory replace the lower price sales, a pattern that can’t be sustainable for long in our market. How will Q1 2020 compare? Will more high end listings continue to flood the market, while the “local’s market” sees fewer and fewer options? How will that affect demand in each of those segments? Stay tuned…

[siteorigin_widget class=”SiteOrigin_Widget_Cta_Widget”][/siteorigin_widget]
[siteorigin_widget class=”SiteOrigin_Widget_Image_Widget”][/siteorigin_widget]
[siteorigin_widget class=”SiteOrigin_Widget_Image_Widget”][/siteorigin_widget]
[siteorigin_widget class=”SiteOrigin_Widget_Image_Widget”][/siteorigin_widget]
[siteorigin_widget class=”SiteOrigin_Widget_Image_Widget”][/siteorigin_widget]
[siteorigin_widget class=”SiteOrigin_Widget_Image_Widget”][/siteorigin_widget]
[siteorigin_widget class=”SiteOrigin_Widget_Image_Widget”][/siteorigin_widget]
Note: All statistics are pulled from Teton Board of Realtors Multiple Listing Service for residential sales/listings in Teton County, WY for the dates specified above. It is estimated that sales outside of MLS account for an additional 10-20% of transactions/volume. Contact Katie for more details.

2019: December Sales & New Listings

What happened in December?

What Sold

December was a slow month for real estate sales, recording only 34 transactions, the third slowest month in 2019. While not typically a busy selling month (December 2018 recorded 32 sales), the dollar value of December sales remained strong, with an average sale price just under $2 million. December saw 3 sales over $5 million including a 6,400 square foot contemporary home in the Snake River Sporting Club, and two 35 acre tracts in Bar BC Ranch. However it wasn’t just the high-end segment of the market that was busy at the end of the year, prices were up across the board as the median sale price jumped up to $1.4 million after holding steady at $1.1 million for the previous 3 months. The sale price to list price ratio remained at 95%, with only 4 properties selling at or above their listing price, perhaps an indication of sellers motivation at year-end. Fifty percent of December sales were for single-family homes and 50% of all monthly sales occurred in the $1-3 million range, highs for both those metrics.

[siteorigin_widget class=”Inked_Number_Counter_SO_Widget”][/siteorigin_widget]

$66,348,239

Total Sales Volume

[siteorigin_widget class=”SiteOrigin_Widget_Image_Widget”][/siteorigin_widget]

167

Average Days on Market

[siteorigin_widget class=”SiteOrigin_Widget_Image_Widget”][/siteorigin_widget]

$1,400,000

MEDIAN SALES PRICE

[siteorigin_widget class=”SiteOrigin_Widget_Image_Widget”][/siteorigin_widget]

35%

Townhome/Condo Sales

[siteorigin_widget class=”SiteOrigin_Widget_Image_Widget”][/siteorigin_widget]

65%

of property sales over $1M

[siteorigin_widget class=”SiteOrigin_Widget_Image_Widget”][/siteorigin_widget]

2

TRANSACTION UNDER $500,000

[siteorigin_widget class=”SiteOrigin_Widget_Image_Widget”][/siteorigin_widget]
[siteorigin_widget class=”SiteOrigin_Widget_Cta_Widget”][/siteorigin_widget]

New Listings

December saw a slight uptick in new listings with 30 properties hitting the market last month.  Not deterred by the slow time of year, 9 new listings came on over $3 million, including a 100+ acre big view property north of town for $14,450,000 and a newly-built 18,000+ square foot home with guest home and barn on 215 acres in the heart of Jackson Hole. Listed at $35 million, it’s rumored to be the most expensive new listing in the country. Skewed by the influx of high-end listings in December, the average listing price jumped up to nearly $4 million. The median listing price also increased in December up to just under $2 million as 21 new listings entered the market priced over $1,000,000 vs just 8 under $1 million (and only two under $500,000). Of December’s 30 new listings, 8 are already under contract or closed.
[siteorigin_widget class=”Inked_Number_Counter_SO_Widget”][/siteorigin_widget]
[siteorigin_widget class=”SiteOrigin_Widget_Image_Widget”][/siteorigin_widget]

$117,512,000

New Listing Volume

[siteorigin_widget class=”SiteOrigin_Widget_Image_Widget”][/siteorigin_widget]

3

Vacant Lot Listings

[siteorigin_widget class=”SiteOrigin_Widget_Image_Widget”][/siteorigin_widget]

$3,917,067

Average List Price

[siteorigin_widget class=”SiteOrigin_Widget_Image_Widget”][/siteorigin_widget]

$1,972,500

MEDIAN LIST PRICE

[siteorigin_widget class=”SiteOrigin_Widget_Image_Widget”][/siteorigin_widget]

2

listings under $500,000 Price Point

[siteorigin_widget class=”SiteOrigin_Widget_Image_Widget”][/siteorigin_widget]

9

Listings over $3M

[siteorigin_widget class=”SiteOrigin_Widget_Image_Widget”][/siteorigin_widget]
[siteorigin_widget class=”SiteOrigin_Widget_Cta_Widget”][/siteorigin_widget]
Note: All statistics are pulled from Teton Board of Realtors Multiple Listing Service for residential sales/listings in Teton County, WY for the dates specified above. It is estimated that sales outside of MLS account for an additional 10-20% of transactions/volume. Contact Katie for more details.

2019: November New Listings in Jackson Hole

What happened in November?

New Listings

New listings continued to decline as we enter the winter season in Jackson Hole. Only 26 properties came to market in November, roughly one-quarter of new monthly inventory levels seen in the busy spring / summer listing season. Overall dollar volume of November’s listings was $45 million, also a far cry from monthly levels of $200-400 million seen in the spring and summer of this year. While November is historically a slow month for new listings, this November appears to be even slower than last year, when 31 properties came on totaling $64 million. After peaking at $3.4 million in October, the average listing price was cut in half, dropping to $1.7 million in November. The median listing price also declined, dipping to $1.125 million. Interestingly, November was one of the few months where the median LIST price was in line with the median SALES price, as inventory that sold in the month was being replaced with inventory of a similar price point (on average). The majority of November new listings were split between the $500,000- $1,000,000 and the $1-3 million price segments, together accounting for 80% of all new November listings. Five high end listings hit the market in November including two homes in Teton Village for $3.5 and $5.4 million, and the iconic Miller House, a historic yellow building on the corner of Broadway and Willow downtown, listed for $4.5 million dollars. Two of the 5 new listings in this high-end segment are already under contract. For the first time since I began tracking new listings in January 2014, there were 0 new listings priced under $500,000 this past month.
[siteorigin_widget class=”Inked_Number_Counter_SO_Widget”][/siteorigin_widget]
[siteorigin_widget class=”SiteOrigin_Widget_Image_Widget”][/siteorigin_widget]

$45,061,000

New Listing Volume

[siteorigin_widget class=”SiteOrigin_Widget_Image_Widget”][/siteorigin_widget]

4

Vacant Lot Listings

[siteorigin_widget class=”SiteOrigin_Widget_Image_Widget”][/siteorigin_widget]

$1,733,115

Average List Price

[siteorigin_widget class=”SiteOrigin_Widget_Image_Widget”][/siteorigin_widget]

$1,187,500

MEDIAN LIST PRICE

[siteorigin_widget class=”SiteOrigin_Widget_Image_Widget”][/siteorigin_widget]

0

listings under $500,000 Price Point

[siteorigin_widget class=”SiteOrigin_Widget_Image_Widget”][/siteorigin_widget]

5

Listings over $3M

[siteorigin_widget class=”SiteOrigin_Widget_Image_Widget”][/siteorigin_widget]
[siteorigin_widget class=”SiteOrigin_Widget_Cta_Widget”][/siteorigin_widget]
Note: All statistics are pulled from Teton Board of Realtors Multiple Listing Service for residential sales/listings in Teton County, WY for the dates specified above. It is estimated that sales outside of MLS account for an additional 10-20% of transactions/volume. Contact Katie for more details.

2019: October New Listings in Jackson Hole

What happened in October?

New Listings

The rate of new inventory hitting the market has dropped significantly in each of the last 2 months. October new listings were only half of the new listings in September and a third of what they were in August 2019. While the busy listing season may be over, thanks to two very high end listings (see below), the overall list volume in October actually increased 26% from September (which saw 50% more listings). The majority of new inventory in October was in the $1-3 million price range where we’ve been seeing the majority of the sales take place for the past 3 months. Only two properties came on under $500,000 – a Hansen Meadows 1 bedroom condo in Town and a deed restricted two bedroom condo south of town – both of which received immediate interest and went under contract quickly. Meanwhile, 10 new listings in October exceeded $3 million, including two very high-end properties: a 6,500 square foot contemporary house up on Spring Creek Ranch for $15 million and a 3 lot, 20 acre estate south of Wilson, listed for just under $25 million. Of the 34 new listings in October, nearly one-third are already under contract or closed illustrating that high demand still exists in the market for well-priced properties.

[siteorigin_widget class=”Inked_Number_Counter_SO_Widget”][/siteorigin_widget]
[siteorigin_widget class=”SiteOrigin_Widget_Image_Widget”][/siteorigin_widget]

$116,318,000

New Listing Volume

[siteorigin_widget class=”SiteOrigin_Widget_Image_Widget”][/siteorigin_widget]

5

Vacant Lot Listings

[siteorigin_widget class=”SiteOrigin_Widget_Image_Widget”][/siteorigin_widget]

$3,421,118

Average List Price

[siteorigin_widget class=”SiteOrigin_Widget_Image_Widget”][/siteorigin_widget]

$1,712,500

MEDIAN LIST PRICE

[siteorigin_widget class=”SiteOrigin_Widget_Image_Widget”][/siteorigin_widget]

5%

under $500,000 Price Point

[siteorigin_widget class=”SiteOrigin_Widget_Image_Widget”][/siteorigin_widget]

10

Listings over $3M

[siteorigin_widget class=”SiteOrigin_Widget_Image_Widget”][/siteorigin_widget]
[siteorigin_widget class=”SiteOrigin_Widget_Cta_Widget”][/siteorigin_widget]
Note: All statistics are pulled from Teton Board of Realtors Multiple Listing Service for residential sales/listings in Teton County, WY for the dates specified above. It is estimated that sales outside of MLS account for an additional 10-20% of transactions/volume. Contact Katie for more details.