2020: March New Listings in Jackson Hole

What happened in March?

New Listings

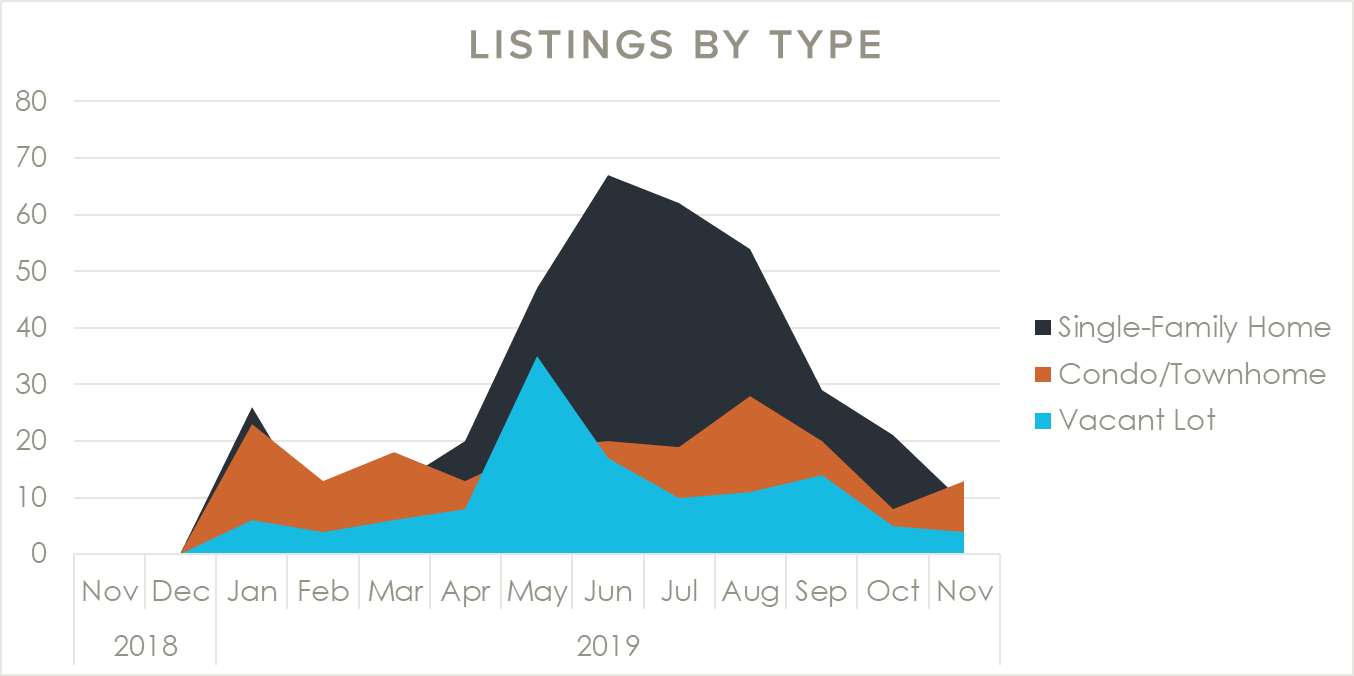
New real estate listings in March dipped slightly from February, with 40 new properties hitting the market. To put that in perspective, last March 2019, 36 new listings entered the market. We typically see a spike in new listings starting in May continuing through June each year (in 2019, 205 new listings hit the market in these two months alone). However, this year is like no other, with COVID-19 disrupting our economy and many people’s daily lives. It will be very interesting to see the number of new listings that enter the market during this spring’s listing season. Will sellers hold off to wait to see what happens to the market? Will panic drive more sellers to dump their properties?
New listing volume dropped significantly in March, down nearly $45 million from February 2020, and dipping below $100 million for the first time since November 2019. As a result, the average listing price dropped to $1.9 million from a high of $3.9 million just 3 months ago in December 2019. Again, it’s typical for the higher-end listings to wait until May / June to enter the market (i.e. last year we saw an average list price of $4.2 million in June). The median listing price was also down in March, dropping $640,000 to just over $1 million as a whopping 19 properties (47.5%!) entered the market between $500,000 – $1,000,000. Despite the snowy conditions, we saw another 8 properties come online over $3 million, including houses in John Dodge, Spring Creek Ranch, Solitude, and Teton Village. So, while new listings continued hitting the market through March despite the early effects of coronavirus, pending sales appear to be down with only 6 these 40 new March listings under contract (as of April 9). Again, I think new listing numbers and dollar volume in April, and more significantly May, will really illustrate the coronavirus’ impact our Jackson Hole real estate market in 2020. Stay tuned!
[siteorigin_widget class=”Inked_Number_Counter_SO_Widget”][/siteorigin_widget]
[siteorigin_widget class=”SiteOrigin_Widget_Image_Widget”][/siteorigin_widget]

$76,223,000

New Listing Volume

[siteorigin_widget class=”SiteOrigin_Widget_Image_Widget”][/siteorigin_widget]

10

Vacant Lot Listings

[siteorigin_widget class=”SiteOrigin_Widget_Image_Widget”][/siteorigin_widget]

$1,905,575

Average List Price

[siteorigin_widget class=”SiteOrigin_Widget_Image_Widget”][/siteorigin_widget]

$1,010,000

MEDIAN LIST PRICE

[siteorigin_widget class=”SiteOrigin_Widget_Image_Widget”][/siteorigin_widget]

1

listings under $500,000

[siteorigin_widget class=”SiteOrigin_Widget_Image_Widget”][/siteorigin_widget]

8

Listings over $3M

[siteorigin_widget class=”SiteOrigin_Widget_Image_Widget”][/siteorigin_widget]
[siteorigin_widget class=”SiteOrigin_Widget_Cta_Widget”][/siteorigin_widget]
Note: All statistics are pulled from Teton Board of Realtors Multiple Listing Service for residential sales/listings in Teton County, WY for the dates specified above. It is estimated that sales outside of MLS account for an additional 10-20% of transactions/volume. Contact Katie for more details.

2020: March Sales in Jackson Hole

What happened in March?

What Sold

Real estate sales in March dipped, down to 23 transactions for all of Teton County, 4 fewer sales than last month (Feb 2020) and 7 fewer sales than March 2019. This dip is most likely not a result of the coronavirus, as many properties that closed in March went under contract in February, prior the current COVID-19 pandemic effects. Despite seeing lower sales, overall dollar volume was up $3 million from February, reaching nearly $64 million. Thanks to 2 very high-end sales in March – a beautiful 103 acre tract along the Snake River adjacent to Grand Teton National Park (listed for $14.45 million) and a 6,700 square foot cabin at 3 Creek (listed for $11.75 million) – the average sale price jumped up to nearly $2.8 million, the highest monthly average sale price in the past 2 years. The median sale price in March (which is not as affected by the high-end / outlier sales) was also up in March, reaching just under $1.6 million, the highest monthly median sale price in the past year. The majority (60%) of property sales were single family homes in March. Only 5 condos/townhomes sold last month, the lowest monthly total since March 2017. Three vacant lots sold in March, including a 5-acre parcel on the Village Road owned by Teton County and originally earmarked for affordable housing. The majority (43%) of March sales occurred in the $1-3 million price point. In addition to the 2 high-end property sales listed above, another 4 properties sold above $3 million, with that segment accounting for 26% of all sales in March.

[siteorigin_widget class=”Inked_Number_Counter_SO_Widget”][/siteorigin_widget]

$63,981,729

Total Sales Volume

[siteorigin_widget class=”SiteOrigin_Widget_Image_Widget”][/siteorigin_widget]

176

Average Days on Market

[siteorigin_widget class=”SiteOrigin_Widget_Image_Widget”][/siteorigin_widget]

$1,595,000

MEDIAN SALES PRICE

[siteorigin_widget class=”SiteOrigin_Widget_Image_Widget”][/siteorigin_widget]

61%

Single Family Home Sales

[siteorigin_widget class=”SiteOrigin_Widget_Image_Widget”][/siteorigin_widget]

70%

of property sales over $1M

[siteorigin_widget class=”SiteOrigin_Widget_Image_Widget”][/siteorigin_widget]

3

TRANSACTION UNDER $500,000

[siteorigin_widget class=”SiteOrigin_Widget_Image_Widget”][/siteorigin_widget]
[siteorigin_widget class=”SiteOrigin_Widget_Cta_Widget”][/siteorigin_widget]

New Listing :: Welcome to Your Jackson Hole

Property Details

  • 3 Bd / 2 Ba
  • 1,235 Sqft
  • South Facing with Natural Light
  • Roof Top Hot Tub with Views
  • Zoned for short term rentals
  • Owners Storage
  • Covered Parking
  • Built in 2013
  • Elevator
[siteorigin_widget class=”SiteOrigin_Widget_Image_Widget”][/siteorigin_widget]
[siteorigin_widget class=”SiteOrigin_Widget_Image_Widget”][/siteorigin_widget]
[siteorigin_widget class=”SiteOrigin_Widget_Image_Widget”][/siteorigin_widget]
[siteorigin_widget class=”SiteOrigin_Widget_Image_Widget”][/siteorigin_widget]
[siteorigin_widget class=”SiteOrigin_Widget_Image_Widget”][/siteorigin_widget]

Conveniently located downtown Jackson at the base of Snow King Mountain, this contemporary condo is a rare find! The new owner of this King Ridge Condominium will enjoy modern finishes, southern exposure, a roof top deck with hot tub and views, elevator and underground parking and storage closet – all while being zoned for short-term rentals. A total of 3 beds and 2 baths, the floor plan allows for 1-bed and 2-bed lock off options. With proven rental income and all furnishings included turn key, this is an incredible opportunity to own an investment property or second home slope-side in Jackson Hole.

[siteorigin_widget class=”SiteOrigin_Widget_Image_Widget”][/siteorigin_widget]
[siteorigin_widget class=”SiteOrigin_Widget_Image_Widget”][/siteorigin_widget]
[siteorigin_widget class=”SiteOrigin_Widget_Image_Widget”][/siteorigin_widget]
[siteorigin_widget class=”SiteOrigin_Widget_Image_Widget”][/siteorigin_widget]
[siteorigin_widget class=”SiteOrigin_Widget_Image_Widget”][/siteorigin_widget]
[siteorigin_widget class=”SiteOrigin_Widget_Image_Widget”][/siteorigin_widget]
[siteorigin_widget class=”SiteOrigin_Widget_Image_Widget”][/siteorigin_widget]
[siteorigin_widget class=”SiteOrigin_Widget_Button_Widget”][/siteorigin_widget]
[siteorigin_widget class=”SiteOrigin_Widget_Image_Widget”][/siteorigin_widget]

429 SNOW KING LOOP, #4

HOA Dues: $5,953/year

Taxes: $6,330/year

List Price: $1,329,000

MLS: 20-478

Virtual Tour HERE


[siteorigin_widget class=”SiteOrigin_Widget_Button_Widget”][/siteorigin_widget]
[siteorigin_widget class=”SiteOrigin_Widget_Image_Widget”][/siteorigin_widget]

2020: January Sales in Jackson Hole

What happened in January?

What Sold

The New Year started out strong with 41 real estate sales in January 2020, an increase of 20% from December 2019. Those 41 sales translated to $90 million in sales volume, the highest monthly volume in the past 3 months. As a result, the average sale price for January 2020 reached $2.2 million, breaking $2 million for the first time since August 2019. The median sale price dropped $130,000 to $1.27 million in January with 34% of all sales occurring under $1 million and another 12 sales occurring between $1,000,000 – $1,300,000. Days on market increased slightly in January, with the average property selling in 191 days, however high demand and well priced listings are selling much more quickly. The sale to list price ratio remained at 95% for the third month in a row, with 7 of the 41 sales occurring at or above the listing price including a stand-alone townhome on East Hall, that received five offers in the first few days of listing, quickly selling for full price of $1,095,000 . The majority (41%) of the sales in January were single family homes, while townhomes accounted for 37% of all sales. Interestingly, there were 9 lot sales in January representing nearly 1 in every 4 sales last month, quite the increase considering that vacant land accounted for an average of 14% of all sales over the last 8 months. Nearly half (44%) of all sales occurred in the $1-3 million range, perhaps signalling a trend after representing 50% of all sales in Dec 2019. The high end segment started the New Year strong with 9 sales over $3 million in January, including several homes around Teton Village in Shooting Star, Granite Ridge, and Lake Creek Ranch.

[siteorigin_widget class=”Inked_Number_Counter_SO_Widget”][/siteorigin_widget]

$89,912,254

Total Sales Volume

[siteorigin_widget class=”SiteOrigin_Widget_Image_Widget”][/siteorigin_widget]

191

Average Days on Market

[siteorigin_widget class=”SiteOrigin_Widget_Image_Widget”][/siteorigin_widget]

$1,270,000

MEDIAN SALES PRICE

[siteorigin_widget class=”SiteOrigin_Widget_Image_Widget”][/siteorigin_widget]

41%

Single Family Home Sales

[siteorigin_widget class=”SiteOrigin_Widget_Image_Widget”][/siteorigin_widget]

66%

of property sales over $1M

[siteorigin_widget class=”SiteOrigin_Widget_Image_Widget”][/siteorigin_widget]

4

TRANSACTION UNDER $500,000

[siteorigin_widget class=”SiteOrigin_Widget_Image_Widget”][/siteorigin_widget]
[siteorigin_widget class=”SiteOrigin_Widget_Cta_Widget”][/siteorigin_widget]
Note: All statistics are pulled from Teton Board of Realtors Multiple Listing Service for residential sales/listings in Teton County, WY for the dates specified above. It is estimated that sales outside of MLS account for an additional 10-20% of transactions/volume. Contact Katie for more details.

2020: January New Listings in Jackson Hole

What happened in January?

New Listings

The first month of the New Year saw 32 new listings enter the market, a slight increase over December 2019, however still roughly one-third of new inventory seen during the summer months. Listing volume topped $110 million for the second month in a row. The average listing price dropped slightly from December but remained strong at $3.4 million, continuing to outpace the average sale price by more than a $1 million for the last 2 months. The median list price spiked in January, topping $2 million for the first time since I began tracking this stat in April 2017. Not a surprise, considering that over 80% of January new listings were over $1 million with a whopping 40% of new listings over $3 million last month. Several high end homes came on the market at 3 Creek ($11.75 million), Solitude ($7.5 million) and a beautiful custom home north of town, listed for $16.9 million (and already under contract!). Only 5 new listings entered the “locals market” ($500,000 – $1 million) and only one property hit the market under $500,000 – a one bedroom condo in East Jackson, listed for $365,000 that received 3 immediate offers. New listings were split almost equally between single family homes (14) and townhomes (13) with 5 vacant lots coming onto the market in January, including a unique parcel on Huffsmith Hill with stunning Teton views, listed for $5.1 million.

[siteorigin_widget class=”Inked_Number_Counter_SO_Widget”][/siteorigin_widget]
[siteorigin_widget class=”SiteOrigin_Widget_Image_Widget”][/siteorigin_widget]

$110,237,000

New Listing Volume

[siteorigin_widget class=”SiteOrigin_Widget_Image_Widget”][/siteorigin_widget]

5

Vacant Lot Listings

[siteorigin_widget class=”SiteOrigin_Widget_Image_Widget”][/siteorigin_widget]

$3,444,906

Average List Price

[siteorigin_widget class=”SiteOrigin_Widget_Image_Widget”][/siteorigin_widget]

$2,347,000

MEDIAN LIST PRICE

[siteorigin_widget class=”SiteOrigin_Widget_Image_Widget”][/siteorigin_widget]

1

listings under $500,000

[siteorigin_widget class=”SiteOrigin_Widget_Image_Widget”][/siteorigin_widget]

13

Listings over $3M

[siteorigin_widget class=”SiteOrigin_Widget_Image_Widget”][/siteorigin_widget]
[siteorigin_widget class=”SiteOrigin_Widget_Cta_Widget”][/siteorigin_widget]
Note: All statistics are pulled from Teton Board of Realtors Multiple Listing Service for residential sales/listings in Teton County, WY for the dates specified above. It is estimated that sales outside of MLS account for an additional 10-20% of transactions/volume. Contact Katie for more details.

New Listing :: Welcome to your Westbank Retreat

[siteorigin_widget class=”SiteOrigin_Widget_Image_Widget”][/siteorigin_widget]
[siteorigin_widget class=”SiteOrigin_Widget_Image_Widget”][/siteorigin_widget]

Property Details

  • 4 bedrooms / 3 baths
  • 3,179 square feet
  • 1.17 private acres
  • Extensive Landscaping
  • Extra Built-in Garage Storage
  • Zoned for Short Term Rentals
[siteorigin_widget class=”SiteOrigin_Widget_Image_Widget”][/siteorigin_widget]
[siteorigin_widget class=”SiteOrigin_Widget_Image_Widget”][/siteorigin_widget]
[siteorigin_widget class=”SiteOrigin_Widget_Image_Widget”][/siteorigin_widget]
[siteorigin_widget class=”SiteOrigin_Widget_Image_Widget”][/siteorigin_widget]
[siteorigin_widget class=”SiteOrigin_Widget_Image_Widget”][/siteorigin_widget]
[siteorigin_widget class=”SiteOrigin_Widget_Image_Widget”][/siteorigin_widget]
[siteorigin_widget class=”SiteOrigin_Widget_Image_Widget”][/siteorigin_widget]

Perfectly situated among mature trees and extensive landscaping, this welcoming Westbank home embraces the Jackson Hole lifestyle. The large 1.17 acre lot provides the utmost privacy while affording tremendous convenience in The Aspens. The expansive outdoor space is a summer sanctuary with a tranquil pond feeding into a stream flowing over hand-laid river rock, a charming custom bridge and several raised beds lush with wildflowers.

The kitchen is finished with granite counters and a breakfast bar and offers access to the south facing sunroom with an indoor hot tub. The main level master bedroom includes a generous walk-in closet, while the nearby office/den could be used as a 4th bedroom. The second level of the home features two comfortable guest bedrooms with a large full bath.

With nearly 3,200 square feet, the functional floor plan can accommodate any sized group yet has a separate space for everyone. Entertain in the spacious great room featuring vaulted ceilings appointed with log beams, a river rock fireplace and floor to ceiling windows.

[siteorigin_widget class=”SiteOrigin_Widget_Image_Widget”][/siteorigin_widget]
[siteorigin_widget class=”SiteOrigin_Widget_Image_Widget”][/siteorigin_widget]
[siteorigin_widget class=”SiteOrigin_Widget_Image_Widget”][/siteorigin_widget]
[siteorigin_widget class=”SiteOrigin_Widget_Image_Widget”][/siteorigin_widget]

Adventure seekers will enjoy the indoor workshop and 2+ car garage with custom built-ins and bonus storage space for outdoor toys. Everyone can unwind on the private back deck overlooking the seasonal stream and mature aspens. This home is zoned for short term rentals and currently generates strong rental income as a “favorite” with Jackson Hole Resort Lodging. Being sold fully furnished and turnkey, a new owner may continue benefiting from the rental income or enjoy it as their year-round home – a cozy ski lodge in the winter (only 10 minutes from Jackson Hole Mountain Resort) and a private escape in the summer.

[siteorigin_widget class=”SiteOrigin_Widget_Image_Widget”][/siteorigin_widget]
[siteorigin_widget class=”SiteOrigin_Widget_Image_Widget”][/siteorigin_widget]
[siteorigin_widget class=”SiteOrigin_Widget_Image_Widget”][/siteorigin_widget]
[siteorigin_widget class=”SiteOrigin_Widget_Image_Widget”][/siteorigin_widget]
[siteorigin_widget class=”SiteOrigin_Widget_Image_Widget”][/siteorigin_widget]
[siteorigin_widget class=”SiteOrigin_Widget_Image_Widget”][/siteorigin_widget]
[siteorigin_widget class=”SiteOrigin_Widget_Button_Widget”][/siteorigin_widget]
[siteorigin_widget class=”SiteOrigin_Widget_Image_Widget”][/siteorigin_widget]

3580 N LAKE CREEK DRIVE

HOA Dues: $920/year

Taxes: $13,722/year

List Price: $2,750,000

MLS: 20-219

Video Tour HERE

[siteorigin_widget class=”SiteOrigin_Widget_Button_Widget”][/siteorigin_widget]
[siteorigin_widget class=”SiteOrigin_Widget_Image_Widget”][/siteorigin_widget]

2019 Jackson Hole Real Estate Summary & 2020 Forecast

Summary: Jackson Hole Real Estate & 2020 Forecast

[siteorigin_widget class=”SiteOrigin_Widget_Image_Widget”][/siteorigin_widget]
[siteorigin_widget class=”SiteOrigin_Widget_Image_Widget”][/siteorigin_widget]
[siteorigin_widget class=”SiteOrigin_Widget_Image_Widget”][/siteorigin_widget]

Market Analysis

Real Estate Sales in Jackson Hole – Past 5 years

We all remember 2018 in the Jackson Hole real estate market, right? An explosive year where everything was up, way up! Transactions increased 13%, while overall sales volume jumped a staggering 38%, and the average sale price was up 22%. What a year! Could it continue? Surely this level of appreciation wasn’t sustainable? Many predicted a recession, or a the very least a stabilization after such a wild year. Well, the 2019 market in Jackson Hole did slow down, but just a bit. While not a significant correction like many were hoping / predicting, the numbers show that 2018 was most likely a “peak” year. With a similar level of sales in 2019, dollar volume decreased 6% and the average sale price dropped 4.5%. The median sale price increased, recording its highest mark in the last 5 years but that is more likely an indication of the “Virginian Village effect” (see sales section above) then a result of increasing sale prices. New this year, I analyzed properties that sold at or above their listing prices, which can help us understand overall demand, as these sales are usually a result of multiple and/or quick offers. In each year since 2016, more and more properties have sold at or above the asking price, peaking in 2018 at 114 property sales (nearly 1 in every 4 sales!). In 2019, with a similar level of overall sales, 87 properties sold at or above their listing price (or roughly 1 in every 6 properties). While not a drastic change, this is another indicator of demand slowing down from the highs of 2018.

Inventory Trends – Past 5 years

After peaking in 2015 (739 new listings), the amount of new inventory entering the market constricted in 2016, down 16% percent. New listing levels have been increasing year-over-year since 2017, recently up 10% from 2018 to 2019 (696 new listings) – marking the most significant increase in over 5 years. After seeing what the market did in 2018, sellers may have wanted to take advantage and cash out, listing their property for sale in 2019. When more inventory (supply) enters the market, this can put downward pressure on pricing, perhaps explaining the slight decline in both sales volume and average sales prices in 2019. Obviously this isn’t true for the entire market, as certain pockets (Town under $1.3 million for example) continue to see high demand (and increasing prices). However, even though there were more listings in 2019, we saw the same amount of sales as 2018 (with fewer new listings), perhaps as some potential buyers sat on the sidelines waiting for a larger market correction.

[siteorigin_widget class=”SiteOrigin_Widget_Image_Widget”][/siteorigin_widget]
[siteorigin_widget class=”SiteOrigin_Widget_Cta_Widget”][/siteorigin_widget]
[siteorigin_widget class=”SiteOrigin_Widget_Image_Widget”][/siteorigin_widget]
[siteorigin_widget class=”SiteOrigin_Widget_Image_Widget”][/siteorigin_widget]
[siteorigin_widget class=”SiteOrigin_Widget_Image_Widget”][/siteorigin_widget]
[siteorigin_widget class=”SiteOrigin_Widget_Image_Widget”][/siteorigin_widget]

2020 Forecast

After a exceptionally strong 2018, I predicted that the unprecedented rate of market acceleration could not continue (see my 2019 forecast). After seeing things slow a bit in 2019, what will 2020 bring? Will things continue to slow or plateau like 2019 or will high demand for Jackson Hole properties once again push pricing upward?

Talks of a pending recession still abound, but will it happen in Jackson? It seems unlikely. Jackson Hole remains a highly desirable place to live for year round families and second homeowners alike. As more and more people can work remotely, many want to make living the dream in Jackson Hole a reality. That will probably never change. As people continue to move here, they will continue to compete for properties with the local buyers. Unfortunately, this can lead to the local working people getting squeezed – beaten out by cash offers and buyers willing to pay over market value to get their spot in Jackson Hole. I predict it getting continually harder and harder for local buyers to enter the market, and increasingly difficult to move up in the market (without taking on a higher mortgage in the process).

There is always uncertainty with an election year. Add to that global trade talks and impeachment hearings and many people are holding their breath and watching the market closely. That being said, many investors are cash heavy, waiting for any recession induced opportunities, suggesting that any slight down turn will be immediately buoyed by an increase in demand.

In a unique market like Jackson Hole, where the supply of land is permanently limited due to publicly held land and  conservation easements, it’s hard to imagine we will see enough new supply (or a decrease in demand) to result in any significant downtown. Happy 2020!


Advice for Sellers in 2020:

Know how your property’s “micro-market”. Certain segments of the market are seeing different levels of demand. Be familiar with recent comps, but even more importantly, current inventory / competition in your segment.

Be prepared for multiple or quick offers in certain segments. Think about what terms are most important to you. Focus on buyer’s enthusiasm and ability to preform.

Prepare your home for sale: de-clutter, clean up, work on deferred maintenance items, etc. Move in ready and remodeled properties are receiving the most attention. Discuss which (if any) updates will produce a higher return.

[siteorigin_widget class=”SiteOrigin_Widget_Button_Widget”][/siteorigin_widget]

Advice for Buyers in 2020:

Know and follow the market. What are the recent comps? How are current inventory levels? What types of properties are selling quickly?

Recognize a good/fair deal and be ready to act quickly as inventory in certain segments remains low. Know that there are many buyers for the same property. How will you position yourself to be the best candidate in a multiple offer situation?

If you need to sell to buy, prepare your home now so that you will be ready to list as soon as you find the right property. Be prepared for things to move quickly when that happens.

[siteorigin_widget class=”SiteOrigin_Widget_Button_Widget”][/siteorigin_widget]
Note: All statistics are pulled from Teton Board of Realtors Multiple Listing Service for residential sales/listings in Teton County, WY for the dates specified above. It is estimated that sales outside of MLS account for an additional 10-20% of transactions/volume. Contact Katie for more details.

2019: Year End Review – Jackson Hole

2019: Transactions/Sales Volume – What Sold?

[siteorigin_widget class=”SiteOrigin_Widget_Image_Widget”][/siteorigin_widget]
[siteorigin_widget class=”SiteOrigin_Widget_Image_Widget”][/siteorigin_widget]
[siteorigin_widget class=”SiteOrigin_Widget_Image_Widget”][/siteorigin_widget]
[siteorigin_widget class=”Inked_Number_Counter_SO_Widget”][/siteorigin_widget]

$890,085,959

Total Sales Volume

$1,805,448

Average Sales Price

[siteorigin_widget class=”SiteOrigin_Widget_Image_Widget”][/siteorigin_widget]
[siteorigin_widget class=”SiteOrigin_Widget_Image_Widget”][/siteorigin_widget]
[siteorigin_widget class=”SiteOrigin_Widget_Image_Widget”][/siteorigin_widget]

Market Analysis

After an explosive 2018 that saw a 13% annual increase in sales and a staggering 38% increase in dollar volume, many predicted that the market would slow in 2019, many thought the market was in need of a correction. The number of real estate sales did not slow down in 2019, recording a nearly identical number of sales as 2018. After under performing 2018 in the first two quarters, transactions increased in Q3 and Q4 of 2019, netting a total of 493 sales* (vs. 494 sales in 2018). What did change in 2019 was the overall dollar volume, dropping 6% percent from 2018, to $890,000,000* in 2019. After starting the year off strong  (2019 Q1 sales volume was up 50% from 2018 Q1), the second quarter of 2019 really under preformed 2018, recording just over half of the sales volume seen in the 2nd quarter of 2018. While the second half of 2019 recorded similar numbers to the same time in 2018, the overall dollar volume of 2019 still came up $45 million short of 2018. With a similar level of sales and less dollar volume, it’s no surprise that the average sale price followed a similar trend (high in Q1, low in Q2 and pretty even in Q3 & Q4) with the end of year average dropping $85,000 (4.5%) to just over $1.8 million. In analyzing the price point breakdown in 2019 vs 2018, a few trends become clear:

  1. The high end market saw a similar level of sales in 2019 (74 vs 76 in 2018). Digging deeper, shows that overall dollar volume of this segment was down 3.5% in 2019, accounting for $412 million in total volume.
  2. Sales seemed to shift from the locals market ($500,000 – $1,000,000), which was down 17%, to the $1-3 million range, which was up 9% from 2018.
  3. The most dramatic change occurred in the sub $500,000 market, where nearly 50% MORE sales occurred in 2019. The 24 additional sales in this price point can be almost entirely explained by the sales of the Virginian Village condos. Condominiumized by the developer several years ago, these 1 and 2 bedroom units located in the heart of Jackson were completely renovated with new appliances, flooring, kitchens, baths, etc. After selling several units FSBO, the remaining units were put on the market with Jackson Hole Real Estate Associates and accounted for 26 sales between Feb – Dec 2019. These condos were in high demand, selling one after the other, with 1 bedrooms selling between $302,000 – $325,000 and 2 bedrooms selling between $402,500 – $435,000.
This influx of inventory and sales in the entry level market, can help explain why, despite a decrease in average sales price, the average monthly median sales price in 2019 was actually up, increasing to $1.15 million from $1.09 million in 2018. With more sales in the bottom end of the market, the median (which measures the middle of the market sales) was pushed up in 2019 because of the additional 26 sales on the low end. In analyzing the property type breakdown, it shows that single family home sales decreased 5%, representing 46% of all sales in 2019, while townhome/condo sales increased in 2019, up 6% representing 40% of all sales. Again, most likely a result of the 26 Virginian Village condo sales in 2019. Land sales represented a similar amount of sales in 2019 (14% vs 12% in 2018).
*Note: All statistics are pulled from Teton Board of Realtors Multiple Listing Service for residential sales/listings in Teton County, WY for 2019, excluding fractional sales and duplicate entries. It is estimated that sales outside of MLS account for an additional 20% of transactions/volume. Contact Katie for more details.
[siteorigin_widget class=”SiteOrigin_Widget_Image_Widget”][/siteorigin_widget]
[siteorigin_widget class=”SiteOrigin_Widget_Cta_Widget”][/siteorigin_widget]
[siteorigin_widget class=”SiteOrigin_Widget_Image_Widget”][/siteorigin_widget]
[siteorigin_widget class=”SiteOrigin_Widget_Image_Widget”][/siteorigin_widget]
[siteorigin_widget class=”SiteOrigin_Widget_Image_Widget”][/siteorigin_widget]
[siteorigin_widget class=”SiteOrigin_Widget_Image_Widget”][/siteorigin_widget]

$1,155,979

Average Median Sales Price

[siteorigin_widget class=”Inked_Number_Counter_SO_Widget”][/siteorigin_widget]

14%

of Sales were Land Lots

[siteorigin_widget class=”SiteOrigin_Widget_Image_Widget”][/siteorigin_widget]
[siteorigin_widget class=”SiteOrigin_Widget_Image_Widget”][/siteorigin_widget]
[siteorigin_widget class=”SiteOrigin_Widget_Image_Widget”][/siteorigin_widget]

2019: New Listing/Inventory Analysis

[siteorigin_widget class=”SiteOrigin_Widget_Image_Widget”][/siteorigin_widget]
[siteorigin_widget class=”SiteOrigin_Widget_Image_Widget”][/siteorigin_widget]
[siteorigin_widget class=”SiteOrigin_Widget_Image_Widget”][/siteorigin_widget]
[siteorigin_widget class=”Inked_Number_Counter_SO_Widget”][/siteorigin_widget]

$1,852,044,899

LIST PRICE Volume

$2,660,984

AvERAGE LIST PRICE

[siteorigin_widget class=”SiteOrigin_Widget_Image_Widget”][/siteorigin_widget]
[siteorigin_widget class=”SiteOrigin_Widget_Image_Widget”][/siteorigin_widget]
[siteorigin_widget class=”SiteOrigin_Widget_Image_Widget”][/siteorigin_widget]

Market Analysis

Buyers had more options in 2019, as 696 new residential listings entered the market, compared to 632 in 2018, an increase of 10%. New inventory levels outpaced 2018 in the first 3 quarters of 2019, with an especially strong Q3 that saw 40 more new listings than the same period in 2018. While the number of new listings increased 10%, the dollar volume of those new listings jumped up 15%, with $243 million more in dollar volume than in 2018. New listing volume outpaced 2018 in 3 of the 4 quarters, with a very strong Q2 seeing $200 million more in listing volume than in Q2 2018. So, not only was more inventory entering the market in 2019, but it did so at higher price points. As a result, the average listing price increased 4.5%, up to $2.66 million in 2019. Sixty-five percent of 2019’s new listings were in excess of $1 million, with the majority (44%) in the $1-3 million range. Fifty-seven properties entered the market priced under $500,000, with the Virginian Village condos accounting for roughly half (28) of the listings. Single family homes accounted for just over 50% of new listings in 2019.

[siteorigin_widget class=”SiteOrigin_Widget_Cta_Widget”][/siteorigin_widget]
[siteorigin_widget class=”SiteOrigin_Widget_Image_Widget”][/siteorigin_widget]
[siteorigin_widget class=”SiteOrigin_Widget_Image_Widget”][/siteorigin_widget]
[siteorigin_widget class=”SiteOrigin_Widget_Image_Widget”][/siteorigin_widget]

$1,412,500

AvERAGE MEDIAN LIST PRICE

[siteorigin_widget class=”Inked_Number_Counter_SO_Widget”][/siteorigin_widget]

65%

Listings over $1 million

[siteorigin_widget class=”SiteOrigin_Widget_Image_Widget”][/siteorigin_widget]
[siteorigin_widget class=”SiteOrigin_Widget_Image_Widget”][/siteorigin_widget]
[siteorigin_widget class=”SiteOrigin_Widget_Image_Widget”][/siteorigin_widget]
Note: All statistics are pulled from Teton Board of Realtors Multiple Listing Service for residential sales/listings in Teton County, WY for the dates specified above. It is estimated that sales outside of MLS account for an additional 10-20% of transactions/volume. Contact Katie for more details.

2019: Q4 Sales & New Listings

Transactions/Sales Volume – What Sold?

$1,930,301

Average Sales Price

[siteorigin_widget class=”Inked_Number_Counter_SO_Widget”][/siteorigin_widget]

$254,799,682

Total Sales Volume

[siteorigin_widget class=”SiteOrigin_Widget_Image_Widget”][/siteorigin_widget]
[siteorigin_widget class=”SiteOrigin_Widget_Image_Widget”][/siteorigin_widget]
[siteorigin_widget class=”SiteOrigin_Widget_Image_Widget”][/siteorigin_widget]

Market Analysis

The 4th quarter of 2019 looked a lot like the 4th quarter of 2018. Total sales increased ever so slightly, up from 130 in 2018 to 132 sales in 2019. In looking at numbers month-by-month, while 2019 saw a few more sales in October and December, it was balanced out by a few less sales in November. Dollar volume was also similar quarter to quarter, and actually dropped 1.7% from Q4 2018, recording a total of $254,800,000 in Q4 2019. Monthly dollar volume in 2019 outpaced 2018 most significantly in October, recording over $108 million in volume vs $91 million in October 2018. November was a bit slower in 2019 while December was identical at $66 million for the month. As expected, the average sale price was also consistent between 2018 and 2019 slipping down to $1.93 million from $1.99 million in 2018. In analyzing price points, sales in the $1-3 million range were up 15% while sales in the $500,000-$1,000,000 range dropped by 17% compared to Q4 2018. This upward shift in price point is reflected in the median sales price, which was higher in each month of Q4 2019. Sales under $500,000 stayed consistent, recording 12 sales in all of the 4th quarter. Townhomes and condos represented slightly more of the sales in 2019, while lot sales remained steady, representing 16% of all sales in Q4 2019.  What does all this mean? While things aren’t necessarily slowing down, the rate of acceleration has appeared to slow. Will we see more of the same in 2020 or is this an indication of the market leveling off as we enter the next decade? Stay tuned!

[siteorigin_widget class=”SiteOrigin_Widget_Cta_Widget”][/siteorigin_widget]
[siteorigin_widget class=”SiteOrigin_Widget_Image_Widget”][/siteorigin_widget]
[siteorigin_widget class=”SiteOrigin_Widget_Image_Widget”][/siteorigin_widget]
[siteorigin_widget class=”SiteOrigin_Widget_Image_Widget”][/siteorigin_widget]
[siteorigin_widget class=”SiteOrigin_Widget_Image_Widget”][/siteorigin_widget]
[siteorigin_widget class=”SiteOrigin_Widget_Image_Widget”][/siteorigin_widget]
[siteorigin_widget class=”SiteOrigin_Widget_Image_Widget”][/siteorigin_widget]

New Listings – What’s New?

$3,023,767

AvERAGE LIST PRICE

[siteorigin_widget class=”Inked_Number_Counter_SO_Widget”][/siteorigin_widget]

$278,891,000

LIST PRICE Volume

[siteorigin_widget class=”SiteOrigin_Widget_Image_Widget”][/siteorigin_widget]
[siteorigin_widget class=”SiteOrigin_Widget_Image_Widget”][/siteorigin_widget]
[siteorigin_widget class=”SiteOrigin_Widget_Image_Widget”][/siteorigin_widget]

Market Analysis

New inventory was down, but listing prices were up in the 4th quarter of 2019, where 18 fewer properties hit the market – a drop of 17% from the same time in 2018. New listings were down every month in the 4th quarter with the biggest drop coming in October, when only 34 properties hit the market (vs. 46 in October 2018). Despite having 17% fewer options in 2019, buyers saw those options increase in price with total dollar volume jumping 12% from Q4 2018. October & December were big dollar months, recording $116 million and $117 million in new listings respectively. As a result, the average listing price jumped up dramatically in the 4th quarter, going from $2.3 million in Q4 2018 to above $3 million in Q4 2019. The median list price saw a more modest, yet still significant, increase from $1.26 million to $1.37 million – a jump of 9%. The spike in dollar volume and average listing price is supported by the price point of several high end listings in Q4 2019. While a similar number of these $3+ million listings hit the market in Q4 2019 and Q4 2018, this past year saw several ultra-high-end listings including: a contemporary home with stunning views atop Spring Creek Ranch for $15 million, a 3 lot estate on 20+ acres south of Wilson for $25 million, and a recently listed 18,000 sq foot home, guest home and barn on 215 acres in the heart of Jackson Hole for $35 million. For much of 2019, we saw higher priced inventory replace the lower price sales, a pattern that can’t be sustainable for long in our market. How will Q1 2020 compare? Will more high end listings continue to flood the market, while the “local’s market” sees fewer and fewer options? How will that affect demand in each of those segments? Stay tuned…

[siteorigin_widget class=”SiteOrigin_Widget_Cta_Widget”][/siteorigin_widget]
[siteorigin_widget class=”SiteOrigin_Widget_Image_Widget”][/siteorigin_widget]
[siteorigin_widget class=”SiteOrigin_Widget_Image_Widget”][/siteorigin_widget]
[siteorigin_widget class=”SiteOrigin_Widget_Image_Widget”][/siteorigin_widget]
[siteorigin_widget class=”SiteOrigin_Widget_Image_Widget”][/siteorigin_widget]
[siteorigin_widget class=”SiteOrigin_Widget_Image_Widget”][/siteorigin_widget]
[siteorigin_widget class=”SiteOrigin_Widget_Image_Widget”][/siteorigin_widget]
Note: All statistics are pulled from Teton Board of Realtors Multiple Listing Service for residential sales/listings in Teton County, WY for the dates specified above. It is estimated that sales outside of MLS account for an additional 10-20% of transactions/volume. Contact Katie for more details.

2019: November New Listings in Jackson Hole

What happened in November?

New Listings

New listings continued to decline as we enter the winter season in Jackson Hole. Only 26 properties came to market in November, roughly one-quarter of new monthly inventory levels seen in the busy spring / summer listing season. Overall dollar volume of November’s listings was $45 million, also a far cry from monthly levels of $200-400 million seen in the spring and summer of this year. While November is historically a slow month for new listings, this November appears to be even slower than last year, when 31 properties came on totaling $64 million. After peaking at $3.4 million in October, the average listing price was cut in half, dropping to $1.7 million in November. The median listing price also declined, dipping to $1.125 million. Interestingly, November was one of the few months where the median LIST price was in line with the median SALES price, as inventory that sold in the month was being replaced with inventory of a similar price point (on average). The majority of November new listings were split between the $500,000- $1,000,000 and the $1-3 million price segments, together accounting for 80% of all new November listings. Five high end listings hit the market in November including two homes in Teton Village for $3.5 and $5.4 million, and the iconic Miller House, a historic yellow building on the corner of Broadway and Willow downtown, listed for $4.5 million dollars. Two of the 5 new listings in this high-end segment are already under contract. For the first time since I began tracking new listings in January 2014, there were 0 new listings priced under $500,000 this past month.
[siteorigin_widget class=”Inked_Number_Counter_SO_Widget”][/siteorigin_widget]
[siteorigin_widget class=”SiteOrigin_Widget_Image_Widget”][/siteorigin_widget]

$45,061,000

New Listing Volume

[siteorigin_widget class=”SiteOrigin_Widget_Image_Widget”][/siteorigin_widget]

4

Vacant Lot Listings

[siteorigin_widget class=”SiteOrigin_Widget_Image_Widget”][/siteorigin_widget]

$1,733,115

Average List Price

[siteorigin_widget class=”SiteOrigin_Widget_Image_Widget”][/siteorigin_widget]

$1,187,500

MEDIAN LIST PRICE

[siteorigin_widget class=”SiteOrigin_Widget_Image_Widget”][/siteorigin_widget]

0

listings under $500,000 Price Point

[siteorigin_widget class=”SiteOrigin_Widget_Image_Widget”][/siteorigin_widget]

5

Listings over $3M

[siteorigin_widget class=”SiteOrigin_Widget_Image_Widget”][/siteorigin_widget]
[siteorigin_widget class=”SiteOrigin_Widget_Cta_Widget”][/siteorigin_widget]
Note: All statistics are pulled from Teton Board of Realtors Multiple Listing Service for residential sales/listings in Teton County, WY for the dates specified above. It is estimated that sales outside of MLS account for an additional 10-20% of transactions/volume. Contact Katie for more details.