

You will love the convenient location of this Love Ridge Condominium! You are just minutes from the excitement of Jackson’s downtown and the outdoor pursuits of Snow King Mountain including skiing, hiking, mountain biking and horseback riding. The southeast orientation allows for a sun filled home as you are welcomed into the living space. Enjoy northeast views over the Elk Refuge from the second floor balcony. These spacious 3 bedroom condominiums have the option for 1 & 2 bed lock off arrangements, which can maximize rental income and add flexibility for owners. Each unit comes with a sizable storage unit as well as 2 parking spots in the underground garage. Sold fully furnished and turnkey for the new owner.
HOA Dues: $7,200/year
Taxes: $8,199/year
List Price: $1,495,000
MLS: 20-2208
Listed by: Katie Brady

Tucked in the woods on a quiet cul-de-sac, this quintessential mountain home is only a 1/2 mile from downtown Wilson. You get it all: true peace and privacy but with unparalleled proximity to the best of Westbank living. A true stand-out for this reason. The home sits on a generous 1.52-acre lot that abuts deeded HOA open space. Soak up the views of the Wilson Faces as you soak in the second story hot tub. Comfortable and inviting, there are two bedrooms on the main floor, a large lofted space currently used as another bedroom, and a new 550 sq foot master suite with gas fireplace. The basement “bunkhouse” accommodates all your friends and family effortlessly. All together, there is approx. 4100 sq. ft. of space in this home to stretch out, relax and enjoy Wilson living at its finest
HOA Dues: $1,000/year
Taxes: $7,685/year
List Price: $2,495,000
MLS: 20-1140
Listed by: Katie Brady & Deb Keenan

Real estate sales in Jackson Hole in the first quarter of 2020 were slightly lower than sales in the first quarter last year. After just barely outpacing 2019 in January and February, a slower than usual March (with 7 fewer sales) contributed to an overall drop in sales from Q1 2019 to this year. Despite having 4 fewer sales, overall dollar volume was up about $15 million in Q1 2020, with higher monthly sales volume in all 3 months of the first quarter this year (even in March which had the 7 fewer sales). After seeing consistent average prices in January and February, the average sale price in March 2020 was up 44% versus March 2019, thanks to several high-end sales last month. As a result, the overall average sale price of Q1 2020 was up 12.5% versus Q1 2019. In looking at the median sale price, we see a somewhat similar trend. After falling short in both January and February, the median sales price in March was significantly higher, recording the highest median sale price in over a year and pulling the overall average of Q1 median sale prices in line with Q1 2019 ($1.415 million vs $1.453 million).
Which price point saw the most sales in the first quarter? Property sales in the $1-3 million range represented the majority of sales in each of the first 3 months in 2020, accounting for 40 of the 91 sales in the first quarter (44%). This is slightly higher than 2019, where 40% of sales occurred in this price point. The first quarter of 2020 saw 3 more high-end sales (above $3 million) but 11 fewer sales in the under $500,000 segment, a decline of 61%. While single family homes made up a similar percentage of sales in Q1 2020 versus Q1 2019, the first quarter of 2020 saw 9 more lot sales and 9 fewer condo/townhome sales than the first quarter of 2019.
The number of new listings entering the market in the first quarter of 2020 was nearly identical to the first quarter of 2019, however the timing of these new listing entering the market was very different. January 2020’s 32 new listings paled in comparison to the 55 new listings in January 2019. This difference may be explained by the fact that after a dynamite 2018, many sellers were encouraged to put their properties on the market in early 2019. February 2020 saw an unusually high number of new listings with 20 more properties hitting the market compared to February 2019. Finishing out the first quarter, new listings in March 2020 were consistent with March 2019. Despite having a similar number of new listings as Q1 2019, the dollar volume of the new listings in Q1 2020 was significantly higher, recording $93 million more in listing volume, an increase of 44%! Even though January 2020 saw 23 fewer sales than Jan 2019, dollar volume was strong ($110 million). February 2020’s new listing volume surpassed January, recording $88 million more in listing volume than February 2019. Finally, March 2020 outpaced March 2019 by $14 million. The average listing price has been declining since a high in December of $3.9 million, dipping below $2 million for the first time since November 2019. Despite the declining trend, the average listing price for the entire quarter was still nearly $1 million higher than the average listing price in Q1 2019. The median list price followed a similar trend. After a high of $2.3 million in January, we’ve seen a significant drop in each of the last two months, down to just above $1 million in March, the lowest median list price in over a year. However, the average median list price of Q1 2020 was still approx. $600,000 higher than this time last year.
The majority (40%) of new listings entered the market between $1-3 million in the first quarter of 2020. February was the most popular month for this price point with 20 new listings hitting the market. Interestingly, March saw a surge of listings in the $500,000 – $1 million segment, when 19 new options entered the market. Comparing quarter to quarter, 2020 saw more new listings in all price points (including the high-end where 10 more listings hit the market) with the exception of the entry level. There were only 5 new listings under $500,000 in the first 3 months of 2020 vs. 24 new listings in Q1 2019. Note: 18 of the 24 new listings represented the newly remodeled Virginian Village Condos, new to the market during Q1 last year.

Conveniently located downtown Jackson at the base of Snow King Mountain, this contemporary condo is a rare find! The new owner of this King Ridge Condominium will enjoy modern finishes, southern exposure, a roof top deck with hot tub and views, elevator and underground parking and storage closet – all while being zoned for short-term rentals. A total of 3 beds and 2 baths, the floor plan allows for 1-bed and 2-bed lock off options. With proven rental income and all furnishings included turn key, this is an incredible opportunity to own an investment property or second home slope-side in Jackson Hole.
429 SNOW KING LOOP, #4
HOA Dues: $5,953/year
Taxes: $6,330/year
List Price: $1,329,000
MLS: 20-478
Virtual Tour HERE
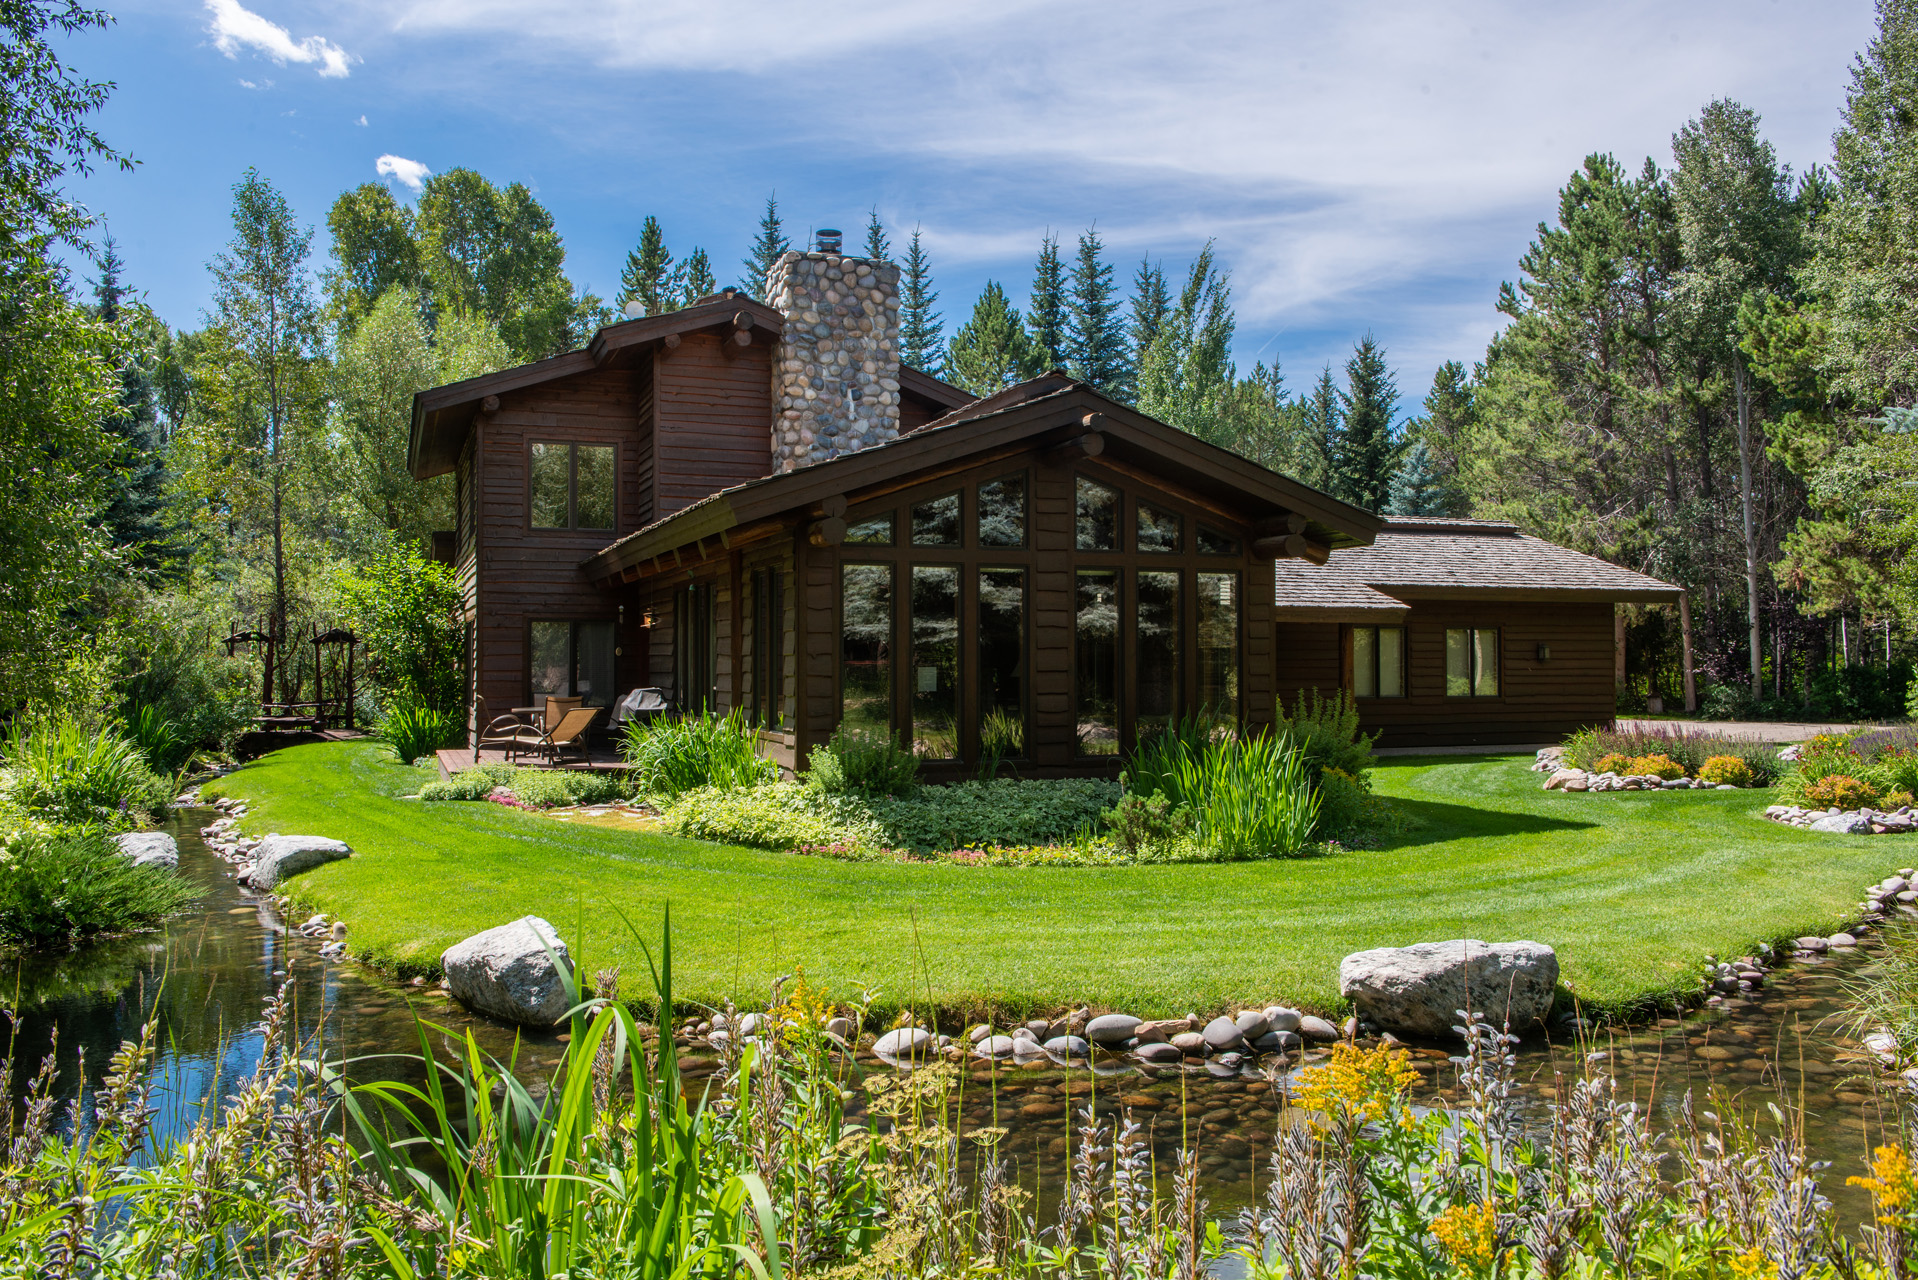
Perfectly situated among mature trees and extensive landscaping, this welcoming Westbank home embraces the Jackson Hole lifestyle. The large 1.17 acre lot provides the utmost privacy while affording tremendous convenience in The Aspens. The expansive outdoor space is a summer sanctuary with a tranquil pond feeding into a stream flowing over hand-laid river rock, a charming custom bridge and several raised beds lush with wildflowers.
The kitchen is finished with granite counters and a breakfast bar and offers access to the south facing sunroom with an indoor hot tub. The main level master bedroom includes a generous walk-in closet, while the nearby office/den could be used as a 4th bedroom. The second level of the home features two comfortable guest bedrooms with a large full bath.
With nearly 3,200 square feet, the functional floor plan can accommodate any sized group yet has a separate space for everyone. Entertain in the spacious great room featuring vaulted ceilings appointed with log beams, a river rock fireplace and floor to ceiling windows.
Adventure seekers will enjoy the indoor workshop and 2+ car garage with custom built-ins and bonus storage space for outdoor toys. Everyone can unwind on the private back deck overlooking the seasonal stream and mature aspens. This home is zoned for short term rentals and currently generates strong rental income as a “favorite” with Jackson Hole Resort Lodging. Being sold fully furnished and turnkey, a new owner may continue benefiting from the rental income or enjoy it as their year-round home – a cozy ski lodge in the winter (only 10 minutes from Jackson Hole Mountain Resort) and a private escape in the summer.
3580 N LAKE CREEK DRIVE
HOA Dues: $920/year
Taxes: $13,722/year
List Price: $2,750,000
MLS: 20-219
Video Tour HERE
Real Estate Sales in Jackson Hole – Past 5 years
We all remember 2018 in the Jackson Hole real estate market, right? An explosive year where everything was up, way up! Transactions increased 13%, while overall sales volume jumped a staggering 38%, and the average sale price was up 22%. What a year! Could it continue? Surely this level of appreciation wasn’t sustainable? Many predicted a recession, or a the very least a stabilization after such a wild year. Well, the 2019 market in Jackson Hole did slow down, but just a bit. While not a significant correction like many were hoping / predicting, the numbers show that 2018 was most likely a “peak” year. With a similar level of sales in 2019, dollar volume decreased 6% and the average sale price dropped 4.5%. The median sale price increased, recording its highest mark in the last 5 years but that is more likely an indication of the “Virginian Village effect” (see sales section above) then a result of increasing sale prices. New this year, I analyzed properties that sold at or above their listing prices, which can help us understand overall demand, as these sales are usually a result of multiple and/or quick offers. In each year since 2016, more and more properties have sold at or above the asking price, peaking in 2018 at 114 property sales (nearly 1 in every 4 sales!). In 2019, with a similar level of overall sales, 87 properties sold at or above their listing price (or roughly 1 in every 6 properties). While not a drastic change, this is another indicator of demand slowing down from the highs of 2018.
Inventory Trends – Past 5 years
After peaking in 2015 (739 new listings), the amount of new inventory entering the market constricted in 2016, down 16% percent. New listing levels have been increasing year-over-year since 2017, recently up 10% from 2018 to 2019 (696 new listings) – marking the most significant increase in over 5 years. After seeing what the market did in 2018, sellers may have wanted to take advantage and cash out, listing their property for sale in 2019. When more inventory (supply) enters the market, this can put downward pressure on pricing, perhaps explaining the slight decline in both sales volume and average sales prices in 2019. Obviously this isn’t true for the entire market, as certain pockets (Town under $1.3 million for example) continue to see high demand (and increasing prices). However, even though there were more listings in 2019, we saw the same amount of sales as 2018 (with fewer new listings), perhaps as some potential buyers sat on the sidelines waiting for a larger market correction.
After a exceptionally strong 2018, I predicted that the unprecedented rate of market acceleration could not continue (see my 2019 forecast). After seeing things slow a bit in 2019, what will 2020 bring? Will things continue to slow or plateau like 2019 or will high demand for Jackson Hole properties once again push pricing upward?
Talks of a pending recession still abound, but will it happen in Jackson? It seems unlikely. Jackson Hole remains a highly desirable place to live for year round families and second homeowners alike. As more and more people can work remotely, many want to make living the dream in Jackson Hole a reality. That will probably never change. As people continue to move here, they will continue to compete for properties with the local buyers. Unfortunately, this can lead to the local working people getting squeezed – beaten out by cash offers and buyers willing to pay over market value to get their spot in Jackson Hole. I predict it getting continually harder and harder for local buyers to enter the market, and increasingly difficult to move up in the market (without taking on a higher mortgage in the process).
There is always uncertainty with an election year. Add to that global trade talks and impeachment hearings and many people are holding their breath and watching the market closely. That being said, many investors are cash heavy, waiting for any recession induced opportunities, suggesting that any slight down turn will be immediately buoyed by an increase in demand.
In a unique market like Jackson Hole, where the supply of land is permanently limited due to publicly held land and conservation easements, it’s hard to imagine we will see enough new supply (or a decrease in demand) to result in any significant downtown. Happy 2020!
Know how your property’s “micro-market”. Certain segments of the market are seeing different levels of demand. Be familiar with recent comps, but even more importantly, current inventory / competition in your segment.
Be prepared for multiple or quick offers in certain segments. Think about what terms are most important to you. Focus on buyer’s enthusiasm and ability to preform.
Prepare your home for sale: de-clutter, clean up, work on deferred maintenance items, etc. Move in ready and remodeled properties are receiving the most attention. Discuss which (if any) updates will produce a higher return.
Know and follow the market. What are the recent comps? How are current inventory levels? What types of properties are selling quickly?
Recognize a good/fair deal and be ready to act quickly as inventory in certain segments remains low. Know that there are many buyers for the same property. How will you position yourself to be the best candidate in a multiple offer situation?
If you need to sell to buy, prepare your home now so that you will be ready to list as soon as you find the right property. Be prepared for things to move quickly when that happens.
After an explosive 2018 that saw a 13% annual increase in sales and a staggering 38% increase in dollar volume, many predicted that the market would slow in 2019, many thought the market was in need of a correction. The number of real estate sales did not slow down in 2019, recording a nearly identical number of sales as 2018. After under performing 2018 in the first two quarters, transactions increased in Q3 and Q4 of 2019, netting a total of 493 sales* (vs. 494 sales in 2018). What did change in 2019 was the overall dollar volume, dropping 6% percent from 2018, to $890,000,000* in 2019. After starting the year off strong (2019 Q1 sales volume was up 50% from 2018 Q1), the second quarter of 2019 really under preformed 2018, recording just over half of the sales volume seen in the 2nd quarter of 2018. While the second half of 2019 recorded similar numbers to the same time in 2018, the overall dollar volume of 2019 still came up $45 million short of 2018. With a similar level of sales and less dollar volume, it’s no surprise that the average sale price followed a similar trend (high in Q1, low in Q2 and pretty even in Q3 & Q4) with the end of year average dropping $85,000 (4.5%) to just over $1.8 million. In analyzing the price point breakdown in 2019 vs 2018, a few trends become clear:
Buyers had more options in 2019, as 696 new residential listings entered the market, compared to 632 in 2018, an increase of 10%. New inventory levels outpaced 2018 in the first 3 quarters of 2019, with an especially strong Q3 that saw 40 more new listings than the same period in 2018. While the number of new listings increased 10%, the dollar volume of those new listings jumped up 15%, with $243 million more in dollar volume than in 2018. New listing volume outpaced 2018 in 3 of the 4 quarters, with a very strong Q2 seeing $200 million more in listing volume than in Q2 2018. So, not only was more inventory entering the market in 2019, but it did so at higher price points. As a result, the average listing price increased 4.5%, up to $2.66 million in 2019. Sixty-five percent of 2019’s new listings were in excess of $1 million, with the majority (44%) in the $1-3 million range. Fifty-seven properties entered the market priced under $500,000, with the Virginian Village condos accounting for roughly half (28) of the listings. Single family homes accounted for just over 50% of new listings in 2019.

The 4th quarter of 2019 looked a lot like the 4th quarter of 2018. Total sales increased ever so slightly, up from 130 in 2018 to 132 sales in 2019. In looking at numbers month-by-month, while 2019 saw a few more sales in October and December, it was balanced out by a few less sales in November. Dollar volume was also similar quarter to quarter, and actually dropped 1.7% from Q4 2018, recording a total of $254,800,000 in Q4 2019. Monthly dollar volume in 2019 outpaced 2018 most significantly in October, recording over $108 million in volume vs $91 million in October 2018. November was a bit slower in 2019 while December was identical at $66 million for the month. As expected, the average sale price was also consistent between 2018 and 2019 slipping down to $1.93 million from $1.99 million in 2018. In analyzing price points, sales in the $1-3 million range were up 15% while sales in the $500,000-$1,000,000 range dropped by 17% compared to Q4 2018. This upward shift in price point is reflected in the median sales price, which was higher in each month of Q4 2019. Sales under $500,000 stayed consistent, recording 12 sales in all of the 4th quarter. Townhomes and condos represented slightly more of the sales in 2019, while lot sales remained steady, representing 16% of all sales in Q4 2019. What does all this mean? While things aren’t necessarily slowing down, the rate of acceleration has appeared to slow. Will we see more of the same in 2020 or is this an indication of the market leveling off as we enter the next decade? Stay tuned!
New inventory was down, but listing prices were up in the 4th quarter of 2019, where 18 fewer properties hit the market – a drop of 17% from the same time in 2018. New listings were down every month in the 4th quarter with the biggest drop coming in October, when only 34 properties hit the market (vs. 46 in October 2018). Despite having 17% fewer options in 2019, buyers saw those options increase in price with total dollar volume jumping 12% from Q4 2018. October & December were big dollar months, recording $116 million and $117 million in new listings respectively. As a result, the average listing price jumped up dramatically in the 4th quarter, going from $2.3 million in Q4 2018 to above $3 million in Q4 2019. The median list price saw a more modest, yet still significant, increase from $1.26 million to $1.37 million – a jump of 9%. The spike in dollar volume and average listing price is supported by the price point of several high end listings in Q4 2019. While a similar number of these $3+ million listings hit the market in Q4 2019 and Q4 2018, this past year saw several ultra-high-end listings including: a contemporary home with stunning views atop Spring Creek Ranch for $15 million, a 3 lot estate on 20+ acres south of Wilson for $25 million, and a recently listed 18,000 sq foot home, guest home and barn on 215 acres in the heart of Jackson Hole for $35 million. For much of 2019, we saw higher priced inventory replace the lower price sales, a pattern that can’t be sustainable for long in our market. How will Q1 2020 compare? Will more high end listings continue to flood the market, while the “local’s market” sees fewer and fewer options? How will that affect demand in each of those segments? Stay tuned…

This beautifully updated mountain contemporary condo enjoys a peaceful and quiet setting along the southern end of The Aspens neighborhood, which is zoned for short term rentals, and is located 5 minutes from the legendary Jackson Hole Mountain Resort. Take in the Teton views from the living room couch, cozy up to the stacked slate fireplace or relax on the back patio watching the seasonal stream flow through the yard. This end unit condo has an extra window, enlarged owner storage closet, desk nook, and is being sold fully furnished. Owners and guests enjoy all the conveniences of being in The Aspens within walking distance to gourmet grocery store and wine shop, gym and outdoor pool, Teton Pines golf course, tennis center and Nordic ski tracks, the START bus stop to Teton Village/Jackson Hole Mountain Resort and access to Teton County’s extensive pathway system.
3890 LAKE CREEK DR. 1113
HOA Dues: $3,483/year
Taxes: $2,753/year
$549,000
MLS: 19-2793